Economic and Investment Outlook for 2018
2018 Outlook Summary
- Economic Growth: Real GDP growth should remain favorable around the world for most developed and emerging market economies. Monetary and/or fiscal stimulus around the world should benefit consumers, workers, and corporate earnings. There is small risk of a U.S. or global recession for at least the next 12-18 months. Higher U.S. inflation in 12-24 months could undermine the long-lived U.S. economic expansion.
- U.S. Equities: Despite stretched valuations in the U.S., a strong economy, still low interest rates, tax reform cost savings, and the likelihood of increased domestic infrastructure and capital spending should benefit U.S. stocks and real estate.
- Foreign Markets: Economic conditions in larger foreign developed and emerging market countries are expected to continue to improve on average, especially in Europe, Japan, and in some of the commodity-producing emerging market countries. Valuations in non-U.S. stock markets are modestly more attractive than in the U.S. Therefore we continue to have a modest overweight to these markets—partly currency-hedged to lower risk.
- Fixed Income: U.S. interest rates are expected to rise if inflation accelerates. Therefore, our fixed income allocation is more heavily weighted to adjustable rate securities and bonds in higher yielding sectors and countries. Corporate default rates are expected to remain below average, thus a modest exposure to high yield and bank loans is still warranted despite lower yields.
Review and Outlook for U.S. Economy and Domestic Investments
Domestic stock markets generally had strong returns in 2017. The S&P 500 was up 21.8% due to strong economic and earnings growth, a cheaper U.S. dollar and favorable tax law changes. Small caps (Russell 2000 index) did well with a 14.7% return for 2017. Small caps lagged the S&P, as they did not include the popular large technology firms that drove the S&P to such large returns in 2017. However, smaller firms may benefit more in 2018 from tax reform, as they generally have less international production and sales than the S&P 500 firms, which generate 43% of sales from outside the U.S.
At about 18.2 times forward estimated earnings, the S&P 500 is above its 25-year historical average of 16. At this level, there is still room for positive S&P returns over the next 5 years at about 5-7% per year, as can be seen from the following chart.
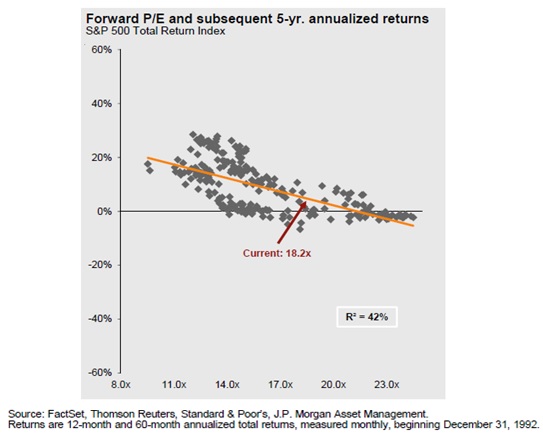
The 18.2 times forward earnings estimates do not yet include the substantial tax savings to corporations from the corporate tax rate being cut from 35% to 21%. Estimates of the 2017 S&P 500 earnings boost from reduced taxes is around 9%. It could be more for smaller and domestically focused firms. Firms that are expected to benefit the most would include regional lenders, transportation, healthcare, and domestic retail and service firms.
Repatriation of money held overseas is also expected to occur as a result of the new tax code. This could fuel stock buy-backs and increase mergers and acquisitions—all positive developments for fueling larger stock market gains. Additionally, this may spur higher capital expenditures, which have been lagging since 2008. This would boost the economy and stimulate what has been very anemic productivity growth. Productivity growth is a key to keeping inflation under control as wage costs are expected to accelerate over the next 24 months.
These factors, as well as strong global growth trends and low unemployment rates, reduce risk of near-term recession or major stock market decline.
Higher U.S. Inflation and Interest Rate Risks Building
Nevertheless, some risk factors are growing, which could trigger more significant stock and bond market declines in 18 to 36 months. The major risk is that both short- and long-term U.S. interest rates rise more than expected. The Federal Reserve has been raising interest rates and is allowing its QE bond portfolio to mature and run off. This reduced monetary accommodation is expected to create a modest headwind for both economic and investment performance. Given the fiscal stimulus of the new tax act, the Federal Reserve may find that it needs to accelerate its interest rate hike program to offset unanticipated higher inflation. This likely won’t be an issue before 2019, but there is a chance we could see this problem develop before the end of 2018.
Aggregate U.S. inflation has been benign for some time, as can be seen here:
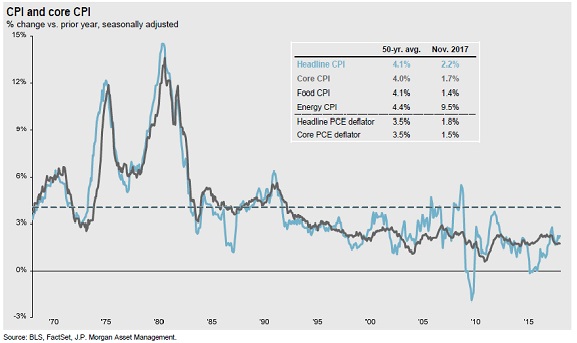
CPI inflation in the last year was close to 2.2% (1.7% for “core” inflation), and most economists are predicting inflation in 2018-19 to be 1.8% to 2%. What if they are wrong and the estimates are too low? Energy costs are rising again, reversing several years of low energy costs. The biggest potential source of unexpectedly high inflation is labor cost. Wages and worker benefits still account for about 70% of the U.S. economy.
The following chart shows that wages rose about 2.3%/year in the 2010-2017 period. Usually when unemployment is as low as it is now, wage growth is closer to the long-term average of 4.1%/year. Reasons that account for such low wage growth include outsourcing work to foreign firms, the anemic pace of general post-2008 economic growth, the use of automation to replace higher-paid workers with lower-paid workers, and the loss of high-paying manufacturing jobs.
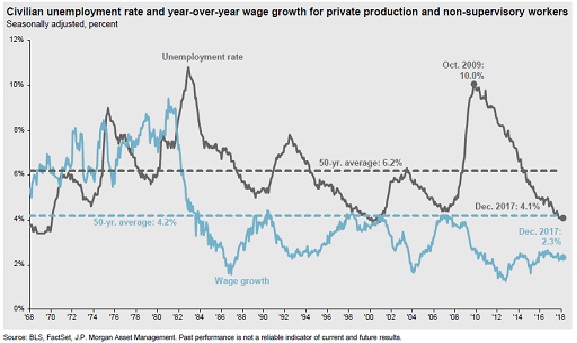
An often overlooked factor is demographic change. As older “baby boomers” retire, they are being replaced with less expensive new job entrants.
However, if one excludes new entrants to the workforce, the wage inflation numbers don’t look as benign. The Atlanta Federal Reserve tracks median wages of those that were working the prior year and excludes new job entrants in the last year. The results are shown in the next chart. The purple line (second from bottom) shows the median wage going up 3.3% last year. The prime age (25 to 54) workers saw a larger wage increase of 3.6%. The youngest wage earners had the largest wage increase, but this reflects starting at a low base and getting large pay increases as they gain valuable experience.
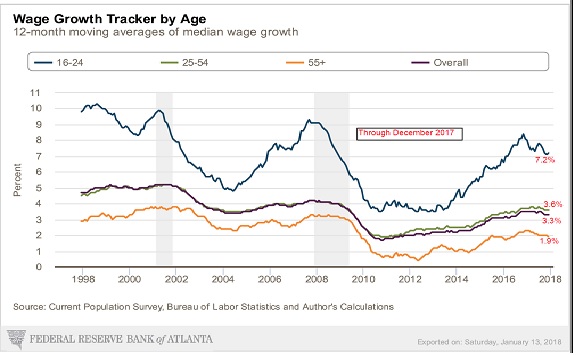
The pace of median wages has increased noticeably from the 2011 lows, reflecting improved economic conditions and lower unemployment.
Over the last few months, the pace of wage increases has decelerated, reducing near-term inflationary pressures. Partially offsetting this is that 20 states have increased the minimum wage by an average 4.4% in 2018, which is expected to cause a boost in labor costs for new job entrants. Furthermore, new job entrants normally do not have the same skills as those recently retired, contributing to lower-than-historical productivity growth and increased inflation pressures.
Another factor suggests that the recent deceleration in wage growth may be temporary. A December research piece by Deutsche Bank shows that when the unemployment rate falls below 4.1%, where it is currently, then wages begin to increase at a faster rate. For every percentage point that unemployment falls below 4.1%, wages increase by 0.83%, whereas above that 4.1% unemployment rate, wages only increase 0.48%. Deutsche Bank and Moodys predicts unemployment to fall to 3.5% by year end 2018. This could add about 0.5% to the normal wage growth by year end, pushing median wage growth for experienced workers to close to 4%. Add in fiscal stimulus from tax cuts, possible infrastructure spending’ and a possible reduction in foreign immigrant workers and we could see 4.5% to 5% median wage inflation in 2019.
Labor productivity improved 1.5% in the last year (third quarter 2017 Bureau of Labor Statistics). If this holds going forward, then 5% labor wage growth, less 1.5% productivity improvement multiplied by 70% of the economy, equals a 2.45% overall inflation addition from this one factor. Higher energy and other costs could push overall inflation to the 3% to 3.5% range by 2019.
Anecdotal evidence of labor shortages and higher wages is building. Trucking firms have had to offer big bonuses to hire drivers from other firms. Home construction starts tailed off last year. It doesn’t appear to be a lack of demand, but due to shortages of both ready-to-build land and construction workers. Oil drilling and fracking firms are having a hard time ramping up to produce more oil now that crude oil prices have risen. Workers left the industry when jobs and wages fell during the 2015-2016 oil bear market, and many workers have moved on to other jobs. This would account for why drilling rig counts are still half the pre-2015 level (see below, left) despite reduced crude inventory and the recovery in WTI crude oil prices to above $60/bbl.

The tightness in the labor markets is confirmed by the November NFIB Small Business Economic Trends. In this survey 18% of respondents reported that “difficulty of finding qualified workers as their single most important business problem,” second in rank only to taxes. For construction and manufacturing firms, it ranked higher than taxes. Additionally, 30% of small businesses stated that they could not fill job openings that were available.
These labor bottlenecks result in higher wage growth. They also slow economic growth and pressure profit margins at firms. We have yet to see meaningful labor strife and strikes, but these may not be too far off. The economic pendulum appears to be shifting from firms to workers—good for workers and for consumer spending, but not so good for business owners and for overall inflation.
If recent trends accelerate and are not accompanied by large productivity improvements, then as the economy overheats and inflation and labor delays pick up, the Federal Reserve is likely to raise interest rates faster than currently forecast. Right now, investors believe that the Federal Reserve will only raise the Fed Funds rate to 2.03% in 2019 (brown dotted line in chart below).
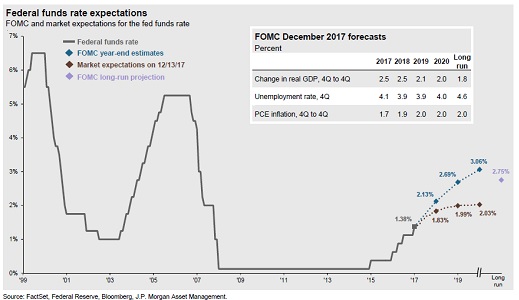
However, if overall inflation unexpectedly rises to 3.5% in 2019 (versus consensus forecasts of 2.3%), then it is conceivable that the Federal Reserve raises short-term rates to about 4% and that long-term rates also rise to about 4% or more due to the higher inflation.
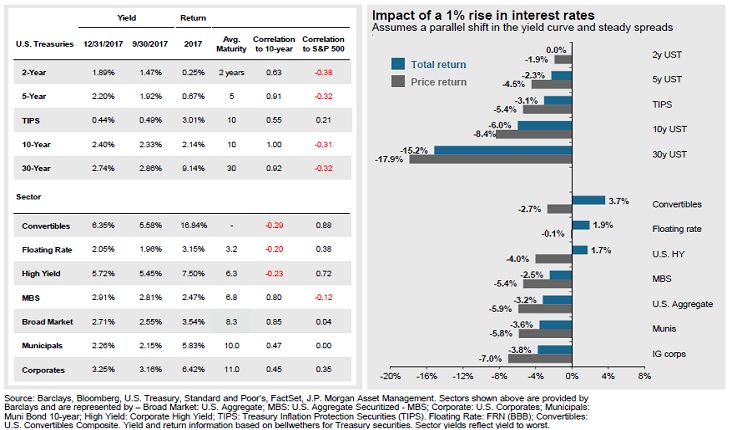
Higher inflation in the U.S. combined with rising interest rates overseas, as European monetary stimulus is expected to be reduced in 12-24 months, would create the conditions for U.S. long-term bond yields to rise substantially. This would be bad for long-term bonds. As the right hand side of the table below shows, a 1% rise in interest rates would cause the 30-year Treasury bond to lose 17.9%. At year end 2017, the 30-year Treasury bond was yielding 2.74%. A rise in yield to 4% by 2019 would cause a price decline of about 20% (left hand side of table shows 2017 total returns and year-end bond yields). Short-term fixed income would be negatively impacted. Variable, adjustable-rate and very short-duration fixed income would do best, which is where WESCAP has been positioned and will continue to be until interest rates rise enough to be attractive to increase duration.
Currently, interest rate and inflation levels are benign enough that our concerns are more about the future than the present. As such, we will continue to monitor facts and trends and we are prepared to take actions if our concerns turn out to be warranted. Avoiding long-term fixed interest rate U.S. bonds and interest rate sensitive stocks (e.g. utilities, REITs, high-dividend consumer staples) are ways to mitigate this risk.
Global Investment Opportunities 2018
As mentioned previously, U.S. stocks still have potential to appreciate, given lower tax rates and strong underlying fundamentals. U.S. long-term, high-quality bonds remain unattractive. Floating-rate and short-term U.S. fixed income (including some preferred stocks) provide an above-inflation yield and with much less risk than stocks. High-yield bonds should provide a modest positive return, as defaults are expected to stay below average for another year.
Energy stocks and MLPs have been laggards in 2017, but improved oil prices and more discipline in U.S. drilling and by OPEC suggest that the price of oil will stay well above its 2015 low and that MLPs and energy stocks can benefit in 2018 from this relative stability. Many commodity-producing countries should benefit as well, though higher energy importing countries (e.g. China, other parts of Asia, and most of Europe) may experience somewhat higher inflation and a modest economic headwind from higher energy prices.
Investment real estate (apartments, most REITs) seems reasonably valued given low current interest rates, but is vulnerable to a rise in interest rates. Single family residential housing prices in 2018 seem well-supported by household formations, wage growth, pent-up demand, low enough interest rates, and a housing supply shortage. Nevertheless, a large run-up in home prices over the last few years–combined with less favorable income tax treatment and potentially higher interest rates later–may slow, but not derail, the U.S. housing market.
Concerns about global trade wars due to Trump administration actions were overblown. In our Outlook from one year ago we thought that “Congress and the courts are likely to water down or otherwise temper the final outcomes to infrastructure spending, trade and immigration policies.” So far this has been the case, and we expect these to continue to largely remain non-issues despite some expected unsettling statements with attendant headline risk.
Eurozone GDP growth appears robust and trending upward, as can be seen in the following graph (left side, JP Morgan). Moreover, unemployment is currently at 8.8% (October), down from the May 2013 high of 12.1%. Unemployment can drop quite a bit more over the next few years before labor conditions get tight in Europe. This allows for the Eurozone to maintain a highly stimulative monetary policy for some time. This should be conducive to continued GDP growth and for continued strong gains in corporate earnings and stock prices.
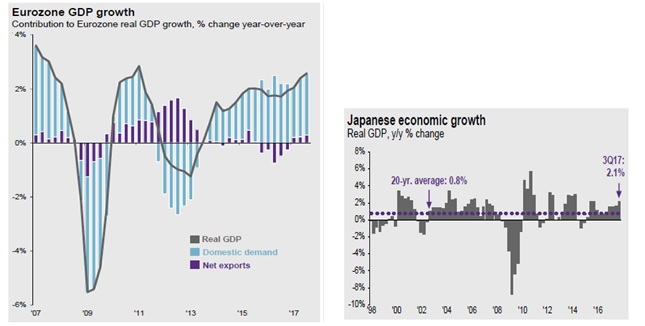
Japan is also showing a modest GDP growth renaissance, largely thanks to monetary stimulus that exceeds that of the Eurozone.
For both Europe and Japan, these conditions have been in place for well over a year. The EAFE global stock index (Japan, Europe, other developed markets stocks, excluding U.S.) increased 25% in 2017, outpacing the U.S. S&P 500 index.
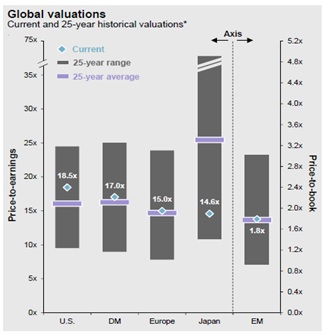
Combine these favorable monetary conditions in Japan and the Eurozone with favorable growth and with more attractive valuations than for U.S. stocks (next chart, JP Morgan Guide to the Markets), and it becomes clear why we find both Japan and European stocks attractive. The U.S. stock market is currently valued above its 25-year average (blue diamond above the lavender bar). Europe and the emerging markets are neither expensive nor inexpensive compared to their 25-year averages, and Japan looks quite inexpensive. We continue to favor a combination of currency-hedged and unhedged ETFs and mutual funds for these markets. Currency hedging can reduce returns, but it also significantly reduces volatility.
In our Outlook of one year ago, we stated “emerging markets have the best valuation and growth characteristics and are likely to be the best performers over the next few years.” This proved true for the last year. Emerging Markets stocks were up 37.3% and Frontier Markets stocks were up 31.9% (MSCI indices) in 2017, making these the best performers of the major global stock indices. Recovery in commodity prices, accelerating synchronized global growth, and strong currencies all contributed. After such strong performances, some pause should be expected in 2018. Nevertheless, economic fundamentals and reasonable valuations suggest further gains ahead in the next few years.
Emerging Markets (EM) dollar-denominated bonds returned 8.2% in 2017 and local currency bonds returned 13.7% (Barclay’s indices). The yield of dollar-denominated EM bonds was 5.3% at year end 2017, which is lower and less attractive than a year ago. They are subject to rising U.S. interest rate risks too, so in 2018 we now favor shorter-term dollar denominated EM bonds, local currency EM bonds, and some Frontier Markets bonds via various ETFs and mutual funds.
Future Asset Class Returns and Conclusions
Over the next 3-5 years, we expect total average annual investments returns to range as follows:
Major Asset Class Future Average Annual 3-5 year Total Return
- U.S. Stocks 4-7%
- Developed Market Stocks 5-8% (excluding currency effects)
- Emerging, Frontier Stocks 6-9% (excluding currency effects)
- Commodity and Energy 4-8%
- High Yield bonds 3-5%
- Emerging Markets bonds 3-6%
- Non-Agency Mortgages 3-5%
- Long-Term U.S. bonds 0-5%
- Short/variable U.S. fixed income 2-4%
Inflation (not an asset class) 3-4%
Annual return variation is expected to be high for stocks and less for fixed income investments. A recession or major economic shock would likely result in returns much lower than shown above, except for the last two asset classes. A recovery in U.S. and global productivity with correspondingly higher GDP growth rates and low interest rates and inflation could result in better returns than expected as well.
WESCAP will continue in its efforts to add value by following a disciplined asset allocation tailored to appropriate risks, with frequent rebalancings and taking advantage of market and valuation trading opportunities. Income tax considerations will also be taken into account as appropriate.
For more details on investment return expectations or anything else in this report, please contact WESCAP Group by email at contactus@wescapgroup.com, or by phone at (818) 563-5170.
