Economic and Investment Outlook for 2019

This year we wish to focus on the main questions investors seem to asking coming into 2019: Is a recession coming? What does this mean for investments?
2019 Outlook Summary
- Economic Growth: Real GDP growth, while slower than 2017, should remain positive around the world for most developed and emerging market economies. Monetary and/or fiscal stimulus around the world should benefit consumers, workers and corporate earnings. More restrictive U.S. monetary policy is expected to slow U.S. growth in 2019. There is a small risk of a U.S. or global recession in 2019-2021.
- U.S. Equities: Tax reform cost savings and the nearly 20% year-end decline in stock prices have resulted in U.S. stocks moving from slightly overvalued to modestly undervalued. This suggests positive returns in 2019 for stocks. Higher interest rates may slow interest rate sensitive sectors: housing, commercial real estate and autos.
- Foreign Markets: Valuations in non-U.S. stock markets are modestly more attractive than in the U.S., but not by a large margin. Therefore, we continue to have a modest overweight to these markets—partly currency-hedged to lower risk. Economic conditions in larger foreign developed and emerging market countries are expected to decline slightly, but the more attractive valuations compensate for this.
- Fixed Income: U.S. interest rates are expected to rise some if inflation accelerates further. Therefore, our fixed income allocation is more heavily weighted to short-term and adjustable rate securities and bonds in higher-yielding sectors and countries.
U.S. and Global Recession Coming?
Will the U.S. enter a recession in 2019? The likely answer is “no,” but nevertheless it is a growing possibility that a recession could occur in 2019, 2020 or 2021. Indications of slowing growth, which could turn into a U.S. recession, include: 1) Rise in loan credit spreads, 2) Yield curve close to inverting, 3) Decline in U.S. and global stock markets (a leading indicator), 4) Up-tick in U.S. unemployment rate, 5) Recent slowdown in U.S. factory orders.
None of these indicators, stock market perhaps excepted, are severe enough yet to point to a recession, but they are trending the wrong way. These trends do suggest that a “recession watch” is in order.
It is this worry about a recession that sent U.S. stocks (S&P 500) down over 19% from peak-to-trough in late 2018. This is just shy of the 20% that is considered a “bear market”. So just how valid a predictor of recession is a bear or near-bear market?


The above graph and chart show that the eleven recessions over the last 70 years were accompanied by stock market declines of nearly 30%. Four of them had declines exceeding 30%. Three of them had stock market declines under the 20% “bear market” threshold. Two bear markets were not accompanied by a recession. In the cases of recession, commodity/oil shocks, overly tight monetary policy or high stock market valuation conditions existed.
The take-aways from this are as follows:
- Bear markets are not great predictors of recessions, though they are often right.
- Recessions sometimes happen without a bear market.
- The recent late 2018 stock market decline has already priced in a modest recession, so the damage has already been done and the worst might be over, recession or not.
In 2018, the nearly 20% S&P 500 decline was 2/3 of the 30% average stock market decline associated with a recession. This suggests that there is some, but not a lot of stock market risk remaining, even if there is a recession.
Furthermore, the last two recessions (2001, 2008) combined bubble overvaluations in stocks (2001) and real estate (2008) with massive excessive debt and other factors that made them worse than average. The ’73-’74 recession was during the extreme inflation conditions of the mid-1970s. None of these extreme conditions exist now. If we look at the remaining 8 milder recessions, the average stock market decline was a more modest 21.5%. In this case, the 2018 U.S. stock market decline has almost completely priced in the full effect of a typical modest recession.
Not shown are the slightly less than 20% market declines. Bespoke Research shows that there have been five post-1945 near-bear market declines (over 19%, but less than 20%), similar to what happened last year. Only one of these was associated with a recession.

The above chart shows that in most years after an S&P 500 decline, the following year typically has above-average returns, the dot.com bust of 2000-2002 excepted. Note that even in years that had good returns, intra-year declines (red dots) have often been in the range of 7% to 15%. Intra-year volatility is the norm and should 2019 end up having a strong performance, we should expect some significant declines during the year, as is the case in most years.
We can also look at investor sentiment indicators as signposts for future market performance. One well-studied, broad sentiment indicator is the weekly polling of its members by the American Association of Individual Investors (AAII). They poll their members on whether they are bullish, bearish or neutral on the stock market.
The December 26, 2018 result showed that 50.3% were bearish. This is more than 2 standard deviations higher than the average bearish reading of 30.6%
Fifty times the AAII weekly survey has had bearish sentiment this high or higher. The subsequent average 6-month S&P 500 gain was 2.8% and for 12 months a 3.1% gain.
| Sentiment Level |
Number of Observations |
Average S&P 500 Change (%) |
Median S&P 500 Change (%) |
% of Periods Correctly Contrarian (%) | ||
| 6-Month Performance | ||||||
| Bearish > +3 S.D. From Mean | 3.0 | 25.8 | 23.0 | 100.0 | ||
| Bearish > +2 S.D. From Mean | 50.0 | 2.8 | 5.3 | 60.0 | ||
| All | 1,319.0 | 4.0 | 4.7 | |||
| 12-Month Performance | ||||||
| Bearish > +3 S.D. From Mean | 3.0 | 35.0 | 25.6 | 100.0 | ||
| Bearish > +2 S.D. From Mean | 50.0 | 3.1 | 14.3 | 60.0 | ||
| Bearish > +1 S.D. From Mean | 152.0 | 7.1 | 11.8 | 74.0 | ||
| All | 1,293.0 | 8.4 | 10.2 | |||
| Based on data from July 24, 1987, to May 2, 2013. Numbers are rounded. | ||||||
The median gains (half being higher or lower than this) were noticeably higher at 5.3% and 14.3% for 6-months and 12-months, respectively, as the 2007-2008 period pulled down the average return, but barely affected the median return. If the 2007-2008 Great Recession bear market effect is eliminated (see below), the average 6-month return jumps to 14.2% and the median return increases slightly to 15%. Furthermore, gains were seen in 96% of the time periods where bearishness was as high as it was at the end of December 2018.
| Number of Observations |
Average
S&P 500 6-Mo Change (%) |
Median S&P 500 6-Mo Change (%) |
% of Periods w/Trend Reversal | |
| Excluding 2007–2009 Bear Market | ||||
| Bearish > +2 S.D. From Mean | 26.0 | 14.2 | 15.0 | 96.0 |
| All Time Periods | 1,247.0 | 5.0 | 5.1 | |
| Numbers are rounded. |
So, assuming we can avoid 2007-2008 Financial Crisis conditions, then S&P 500 returns are likely to be strong over 2019.
Extreme sentiment readings tend to be powerful contrarian indicators, as shown above. When investors are very pessimistic, they are fearing the worst, but the worst rarely happens; thus they overreact, selling stocks and other higher-risk assets near the bottom. However, once the most distressed investors have sold, the selling pressure abates, setting up the conditions for a strong rally.
Stock Market Dynamics and Fundamentals
Algorithmic trading (computer models and passive formulas) account for about 85% of daily trading in the U.S. (Wall St Journal 12/25/18). Overall, these formulas and trading models seem to amplify market movements, generating larger gains and losses, depending upon prevailing conditions. This leaves only 15% of trading being done by investors applying reasoned logic and research to their investment decisions. Therefore, in the short-run, the fundamentally grounded investor is swamped by the effects of algorithmic trading. If you can’t beat algorithmic traders at their own game, play a different game. Focus longer-term rather than shorter-term and focus on company, market and economic fundamentals rather than short-term price movements. It does mean taking a longer view—several months to several years—and ignoring the higher short-term, sometimes violent volatility movements that comes along with the new algorithmically driven trading paradigm.
So, what are the fundamentals? Market fundamentals for stocks look good. U.S. stocks are inexpensive right now. The reduction in U.S. corporate taxes has provided a big boost to aggregate corporate earnings, cash flows and profit margins. This can be seen in the next graph.
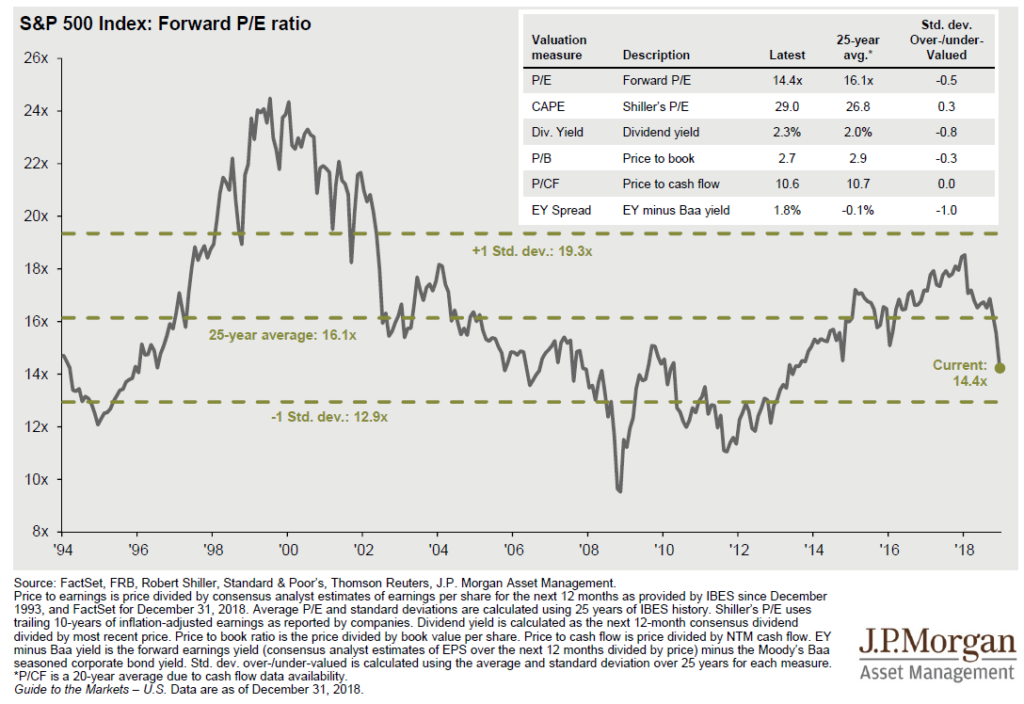
The current forward-looking P/E ratio is 14.4, which is considerably lower than the 25-year average of 16.1. Part of this is due to stocks dropping in price in 2018, but more is due to the tax savings and operating profits growth in 2018. The stock market would need to rise 11.8% just to get back to its 25-year average valuation.
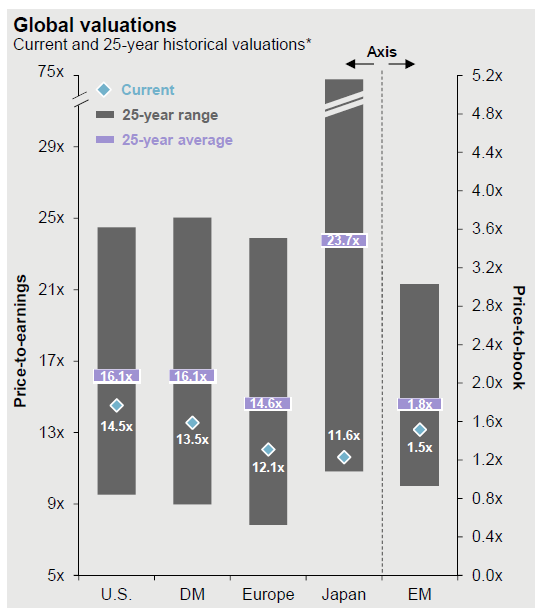
Inexpensive valuations exist for most global stock markets as well. The blue diamonds shown on the following graph indicate that current valuations are below their respective 25-year averages for not only the U.S., but also for developed markets as a whole, and for Europe, Japan and the emerging markets. This does not mean that all of these markets will go up immediately, but longer-term returns do tend to be greater when markets are more inexpensively valued.

Fixed Income Investments
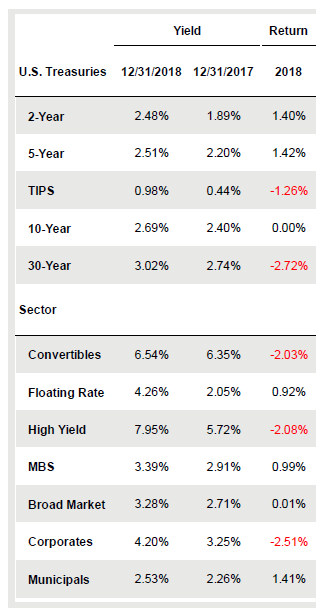
Fixed income investment yields in the U.S. generally rose last year. Short-term interest rates rose due to Federal Reserve policy actions, moving away from interest rates well below the inflation rate to a more “neutral” level at or slightly above the inflation rate. By year-end 2018 (see next chart), the 2-year Treasury note was yielding nearly 2.5%, which is above the PCE and CPI inflation rates, both at 1.9% in 2018.
Long-term Treasury yields also rose due to a stronger economy, slightly higher inflation, increased supply of new Treasuries being issued to fund larger budget deficits and the Federal Reserve letting its prior QE bond purchases mature and run off.
Corporate bond and high-yield bond yields also rose as they were affected by the rise in Treasury yields and concerns regarding future credit quality and default risk.
Higher interest rates on corporate bonds and long-term Treasury bonds resulted in price declines in 2018 as prices and interest rates are inversely correlated. Floating-rate and short-term bond prices are relatively unaffected by changes in interest rates. U.S. fixed income 2017, and 2018 year-end yields for 2017, 2018 and 2018 total returns are shown in the next chart (source: JP Morgan, Bloomberg).
Corporate borrowing has increased the last five years as can be seen in the next chart.
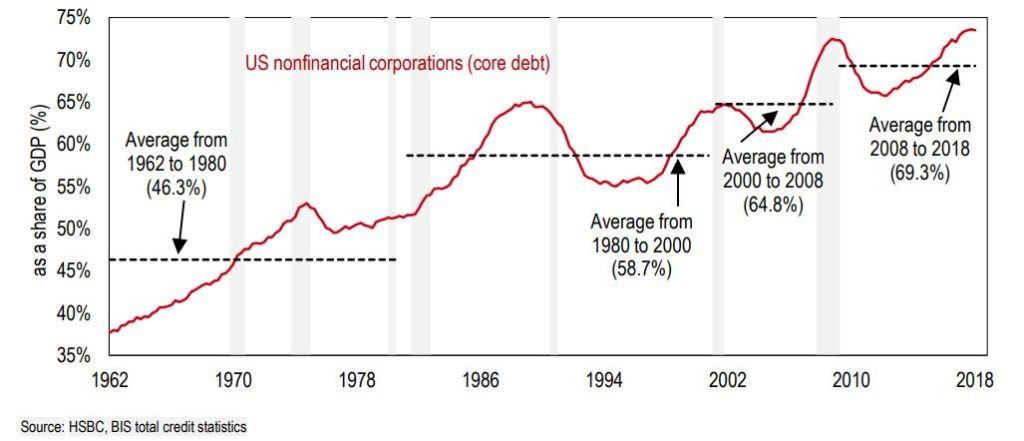
Too much corporate debt is a growing concern for many investors. However, this doesn’t account for the effects of lower interest rates and the large corporate tax cuts. Higher interest rates, should they occur, will put some stress on weaker firms. For firms that had paid a 35% corporate tax rate, but are now paying 21%, the increase to cash flow is 21.5%. Of course, not all companies pay taxes only in the U.S. and reported earnings and cash flow are not identical, but a 10% to 15% increase in average cash flow is not unreasonable for most profitable U.S. firms and thus they can afford a higher debt level than previously. Therefore, until we have a major, deep recession, the large increase in corporate debt should not be a major source of alarm. Nevertheless, there are some firms that have taken on large amounts of debt and have very little in profits. These firms will not benefit much from the tax cuts and therefore will be hurt in a business slow-down or from higher interest rates. As a result, we expect that over the next 3 to 5 years it will pay to discriminate in favor of firms and industries that have not binged on the low-cost debt that has been made available to businesses the last few years.
Until a recession is close at hand, corporate debt (high-quality, high-yield and floating-rate bank loans) have attractive, above-inflation yields. Short-term debt has lower yields, but is more attractive for conservative investors and those who might need to sell these assets to fund near-term expenses. Longer-term Treasuries are very price sensitive to interest rates and should be owned when interest rates decline, as often occurs in recessions, but otherwise avoided.
Foreign bonds have a much wider range of interest rates, depending upon country of origin and whether they are issued in dollars or local currencies. Suffice to say some are very attractive while others are not. Additional details are available upon request.
Consumer Financial Health
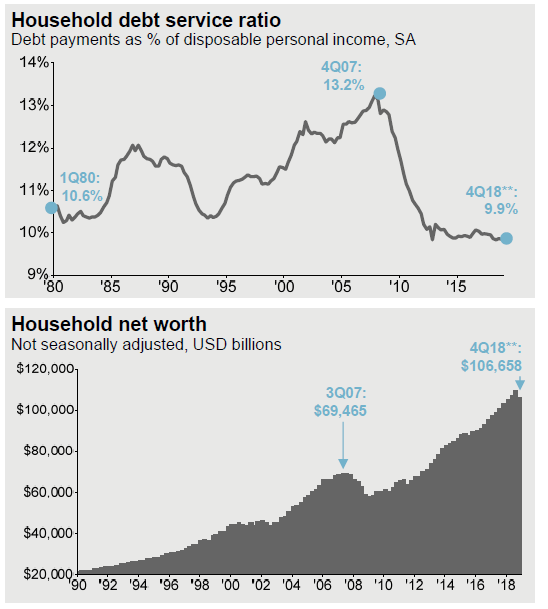

The average U.S. household is in good financial shape as can be seen in the preceding graphs. As the U.S. consumer accounts for 68% of annual economic U.S. output, if they are in good shape, so too normally is the economy. Household debt service (including mortgages) relative to income is the lowest in at least 38 years. Household net worth is well above the 2007 prior high. Unemployment is near a multi-decade low at 3.7%. This is up 0.2% from the recent low, but is more of a reflection of an influx of new job-seekers than any weakness with job demand. The fourth quarter 2018 Business Roundtable CEO Economic Outlook showed CEO plans on hiring new workers at the fourth highest level ever, though slightly lower than earlier in 2018. Their biggest cost pressure was from labor costs, as it is increasingly difficult to attract and keep enough workers to maintain and grow their businesses. Wages (Bureau of Labor Statistics) showed wage growth at 3.2% in 2018, with a slight acceleration at year-end. Additionally, fourth-quarter consumer spending was robust. It would be extremely unlikely that very strong household/consumer conditions would so quickly reverse to result in a recession in 2019.
Interest Rates and Risks of Recession
One of the leading causes of recessions is higher interest rates. This slows business expansions and delays purchases of homes and autos, which are often financed via loans. Interest rates can increase for a variety of reasons, including higher inflation rates, a scarcity of lendable funds and central bank monetary tightening.
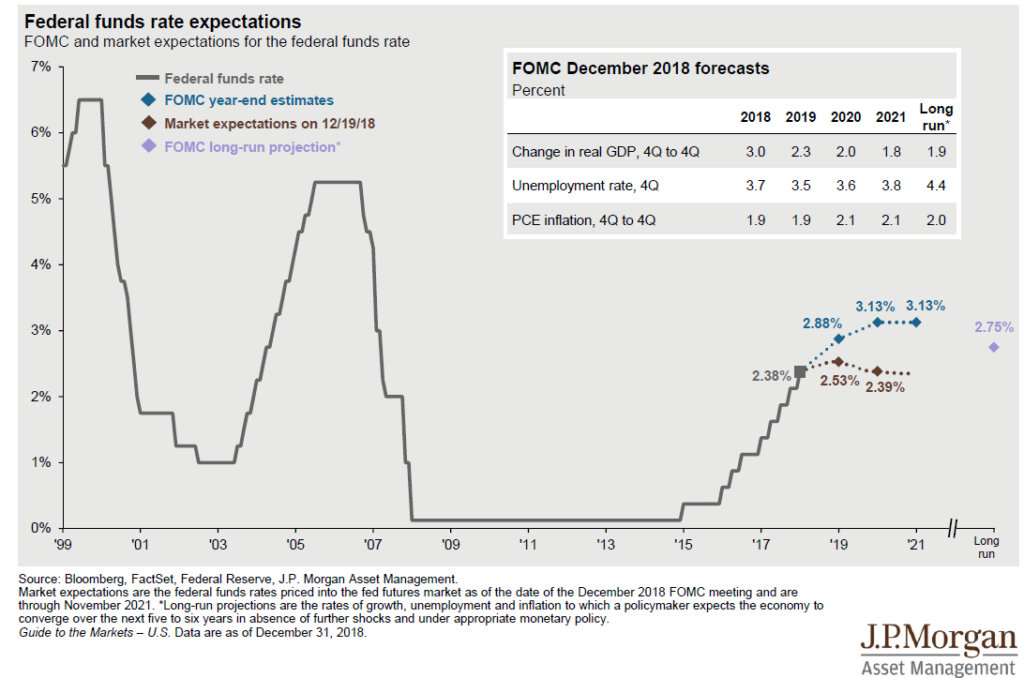
Inflation at 1.9% the last four quarters (see table above) is not excessive,
nor is a material pick-up forecast for 2019 or 2020. Banks have reserves to lend and corporate
bond issuance has been robust, so neither inflation nor scarcity of lendable
funds appear to be a near-term risk.
However, the Federal Reserve (“Fed”) has been raising short-term
interest rates at a steady pace, starting at the end of 2015. The current Fed Funds target rate of 2.38% is
modestly above the inflation rate, which is normal and considered close to
“neutral”—not too high or too low.
Interest rates too high can choke off business activity and rates too
low encourage speculation and asset bubbles.
The Fed projects that it will raise interest rates to 3.13% by 2021, but
market expectations (brown dashes above) suggest only one more interest rate
increase.
If inflation accelerates, short-term interest rates could rise further than forecast. This could cause a yield curve inversion in which short-term interest rates are higher than long-term interest rates. This matters because an inverted yield curve has preceded every recent recession. The next graph shows the 10-year Treasury note yield minus the 1-year T-bill yield. Since 1960, this yield spread difference has been negative on nine occasions. Twice a recession did not follow, but the other seven times a recession did occur. The average time from yield curve inversion to recession was 14 months.
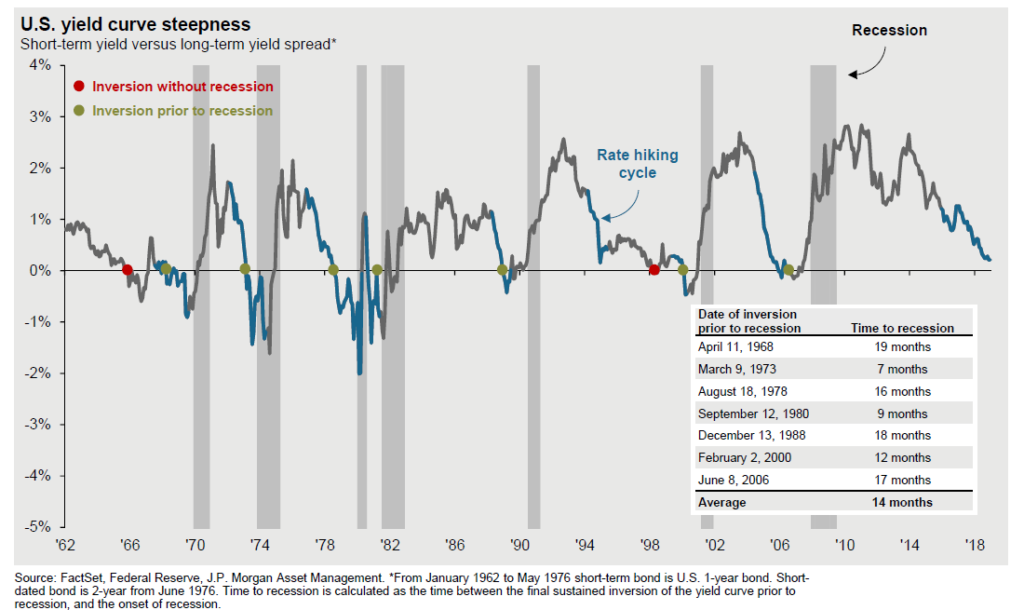
Currently the yield curve is not inverted. When and if it does invert, we may have about 12 to 18 months before we might expect a recession to begin. As stock bear markets often start about 6 to 9 months before a recession begins, then it is likely that the stock market will not peak until 3 to 12 months after the yield curve inverts. If the yield curve does invert in the second quarter of 2019, this would suggest a U.S. stock market peak near the end of 2019 or by mid-2020. In any case, there should be ample time to reduce stock market exposure after the yield curve inverts.
Some of the best stock market returns occur between 12 and 24 months prior to the beginning of a recession. During the last eleven recessions, the S&P 500 rose on average 17.4% for the one-year period ending just 12 months prior to the recession (source: seeitmarket.com). The worst result in the last eleven recessions for this period was an 8% return. The 6 months just prior to the recession is when stock market performance tends to be the worst, with an average market return of negative 3.2% and with only three instances of positive returns. So, cutting back now for a recession that may occur in 2020 (or later) seems a bit premature.
Lastly, regarding the prior chart, note that there were two yield curve inversions that were not followed closely by a recession (red dots on prior chart). The next chart shows 3-month T-bill yields, with recessions shown in grey. Prior to each recession, T-bill yields equaled or exceeded 6% (2007 excepted). The two times when the yield curve inverted, but without a recession, the T-bill rate never got to 6%. So, yield curve inversions when rates are not too high (under 6%) don’t seem to signal a recession. If interest rates top out at a low level, even if the yield curve inverts, it appears business activity isn’t impaired enough to cause a recession. 2007 was the exception as the T-bill rate barely hit 5% and then came down rapidly in 2008 with a recession following. It can be argued that in 2007 it was not short-term rates being too high that triggered the recession, but that the abnormally low interest rates in 2001-2005 created a speculative real estate and financial bubble that then broke in a financially devastating manner in 2007-2008.
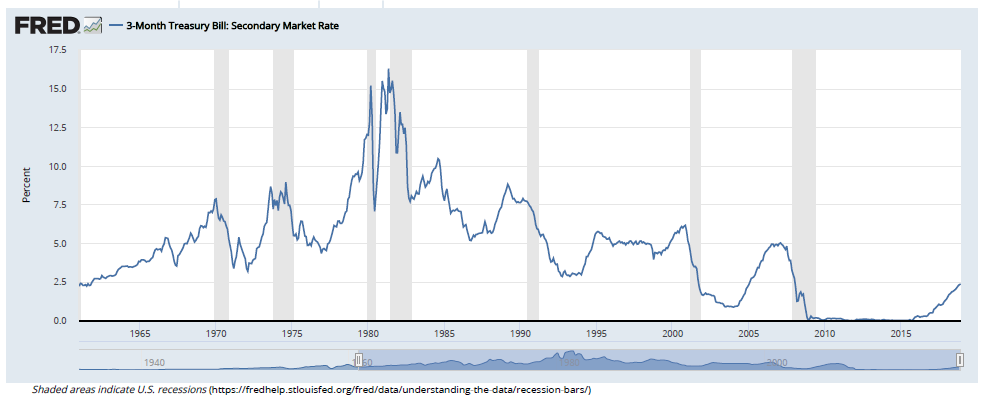
The T-bill rate now is at 2.4%, and even if it climbs to 3.2% in 2019, this low a peak for short-term interest rate is probably well below the punitively high interest rates that depress business conditions and have triggered recessions in the past.
Interest rates in the 2008-2016 period have also been abnormally low, which may have distorted asset prices as well. Long-term bond yields were also low in this period and the possibility of a “bubble” in long-term bond prices cannot be ignored. We could thus see prices drop (yields rise) in these bonds as the bubble deflates. Real estate prices, while not in bubble territory, certainly benefited from abnormally low interest rates and are thus also susceptible to price weakness if longer term rates begin to rise to “normal” levels. Nevertheless, unless inflation picks up quite a bit the next few years, then interest rate increases should be modest and a bubble collapse recession can be avoided. Wage inflation should remain relatively tame due to a variety of factors. Low energy prices and a strong dollar should put downward pressure on inflation in the near term as well. However, these inflation metrics should be monitored for deterioration as they are the likely future culprits that could cause interest rates to rise to a punitive level. Any problems of this nature are unlikely to occur until 2020 or 2021.
Foreign Markets/Trade Issues
China, Germany and over half of the World MSCI stock market indexes fell 20% or more in 2018, constituting bear markets for over half the world. China’s economic growth is slowing quickly, though unlikely to fall into recession due to China’s strong control over potential stimulus measures. Germany is another matter, with the economy flirting with mild contraction (recession) and Europe showing weak economic growth. Japan appears stable, but growing slowly as usual, due to Japanese demographics. The World Bank in January 2019 downgraded global growth estimates, citing trade issues as part of the reason. The downgrade was small, with overall global growth for 2019 now estimated at 2.9% instead of 3%.
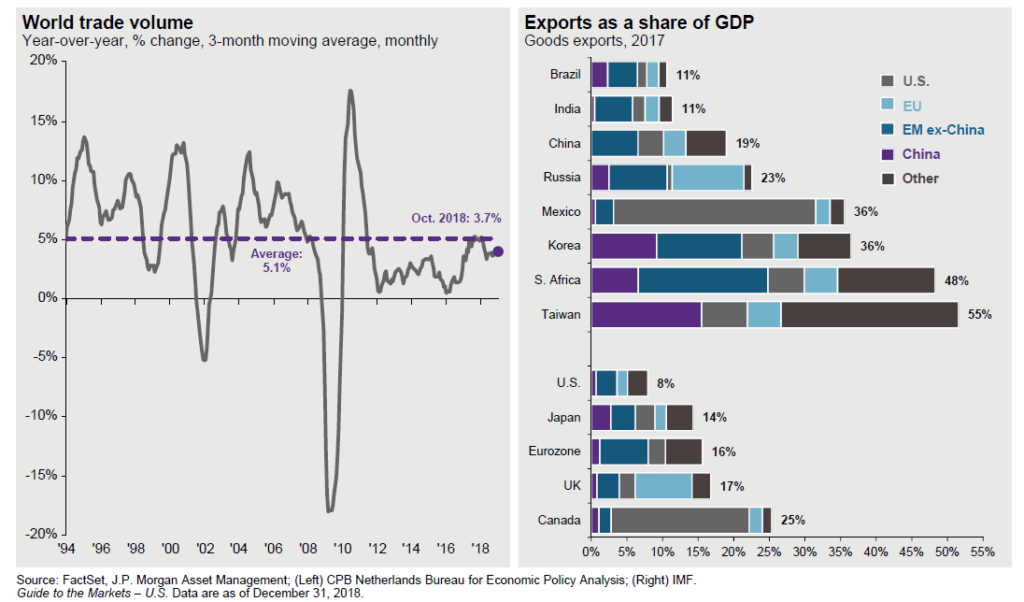
As shown on the upper left graph, trade volume has recently receded from 5% annual growth to 3.7%. The right side shows how much exports are as a percent of GDP for major exporters. Exports constitute 16% of 2017 GDP for the Eurozone. For China, they are 19%. For the U.S., exports are lower at 8% of GDP. World trade is an important part of the global economy. Consequently, U.S. 10-25% trade tariffs on China, and to a lesser extent Europe (on steel and aluminum), as well as reciprocal trade tariffs on U.S. goods are beginning to have a negative effect on global trade and global economic growth.
While trade tariffs are not good for the U.S. economy, it appears to be even more detrimental to the Chinese and some other trade-partners’ economies. Therefore, the current tariffs imposed by the U.S. may ultimately result in sufficient concessions to reduce trade barriers worldwide and stimulate more U.S. and global growth. But in the short run the reciprocal trade tariffs are causing impediments to global growth.
How serious is this? Probably not as much as many people and press make it out to be. First, both the euro and yuan currencies have declined relative to the dollar, making their exports to the U.S. cheaper and offsetting some of the tariff impacts for U.S. buyers. Second, nations have figured out ways to circumvent tariffs for many products. Shipping U.S. soybeans to Canada and then re-exporting to China or shipping products from China to Vietnam for relabeling and shipping to the U.S. is not difficult. Some products (e.g. automobiles, aircraft) are intrinsically associated with their country of origin, so this reshipping doesn’t work for everything, but for bulk, undifferentiated products (many commodities), the tariff effects are likely to be at least partially circumvented. Also, simple economics tells us when demand drops, prices drop too. So, if U.S. demand for Chinese steel drops due to the 25% tariff, then the price of Chinese steel drops as well, thus muting part of the impact of the tariff (holding all else constant). The price of non-Chinese steel would go up as well due to higher demand, therefore making Chinese steel still somewhat competitive. Plus, as mentioned earlier, the Chinese currency declining also helps keep Chinese exports to the U.S. reasonably priced. Therefore, in the U.S., it is likely that supply chain disruption and higher import prices will not be a major issue. For China, business will not be as negatively impacted too, though a cheaper yuan will raise their import prices and be a source of inflation. As a result, the trade war poses more risk for China than for the U.S.
A second issue with the “trade war” is the uncertainty that business leaders face with potentially higher import costs, tariff costs on exports reducing demand and determining the correct level of capital expenditures needed to meet current and expected demand.
Business confidence is still high, but some deterioration has begun. The fourth quarter 2018 Business Roundtable CEO Economic Outlook showed CEO plans for capital investment to be slightly lower than the prior quarter, but it is still showing the 10th highest reading in the survey’s history. Also, if the tariffs and trade barriers remain longer than expected or even become permanent for some products and services, then multi-national firms may feel compelled to make more capital expenditures inside countries with high demand to avoid the tariffs and barriers. More foreign car firms may build factories in the U.S. and more U.S. firms may build capacity in other countries. Current trade frictions may just delay and shift capital expenditures rather than permanently curtail them. Additionally, in the U.S., business capital spending is expected to accelerate due to it being a more cost-effective substitute for increasingly high-cost, less-qualified labor. This may have additional benefits of expanding GDP growth due to the capital expenditures and also increasing per-worker productivity, thus keeping inflation under control.
The same survey stated that 82% of CEOs see a strong or moderate benefit from “removing current and preventing future barriers to trade including tariffs”. Pressure is being applied to governments by businesses around the world to alleviate the bulk of the trade tariffs recently imposed. Canada and Mexico have already reached agreement with the U.S. Europe is likely next. While progress with China is underway, the trade differences are wider between China and the U.S., and it would not be surprising to see some progress made soon on some fronts, with other stickier issues dragging on for some time. Nevertheless, even partial progress with China and others should alleviate some of the concerns that the global economy will sink into recession due to trade tariffs and barriers.
Future Asset Class Returns and Conclusions
Over the next 3-5 years, we expect total average annual investments returns to range as follows:
Major Asset Class Future Average Annual 3-5 year Total Return
- U.S. stocks 4-8%
- Developed Market stocks 5-8% (excluding currency effects)
- Emerging, Frontier stocks 6-9% (excluding currency effects)
- Commodity and Energy 4-8%
- High Yield bonds 3-6%
- Emerging Markets bonds 3-6%
- Non-Agency mortgages 3-5%
- Long-Term U.S. bonds 1-5%
- Short/variable U.S. fixed income 3-4%
Inflation (not an asset class) 2.5-3.5%
Annual return variation is expected to be high for stocks and less for fixed income investments. A recession or major economic shock would likely result in returns much lower than shown above, except for the last two asset classes. A recovery in U.S. and global productivity with correspondingly higher GDP growth rates, low interest rates and low inflation could result in better returns than expected as well.
WESCAP will continue in its efforts to add value by following a disciplined asset allocation tailored to appropriate risks, with frequent rebalancings and taking advantage of market and valuation trading opportunities. Income tax considerations will also be taken into account as appropriate.
For more details on investment return expectations or anything else in this report, please contact your WESCAP Group advisor.
