Tech Bubble Déjà Vu?
Executive Summary
- Market Capitalization of 5 largest stocks approaching levels of previous stock market bubbles
- Indications are mixed as to whether a bubble exists, but enough to be on a bubble alert
- Prudence suggests not being overly reliant on the largest firms and Tech stocks in general
- Make sure there is an allocation to various laggard assets, as they could outperform later
For over a decade now, we have witnessed a prolonged cycle in which growth stocks – particularly large technology companies – have significantly outperformed most other U.S. stocks. Additionally, U.S. stocks overall have far outperformed foreign stocks over the same time period. As a result, we are now experiencing one of the largest divergences in performance between these large growth stocks and the rest of the stock market. This has also resulted in the five largest U.S. companies taking a very large share of the entire U.S. stock market, and the global stock market. This is very reminiscent to conditions just prior to the Tech Bubble that burst in 2000. How real or imminent is this risk? Is it time to seek other alternatives?
Current and Past U.S. Stock Market Concentration
While the S&P 500 has enjoyed outsized returns in recent years, most notably during the current pandemic, much of this performance can be attributed to the five largest companies in the index: Microsoft, Facebook, Amazon, Apple, and Alphabet (Google).
As seen in the below chart, the five largest companies in the S&P 500 now account for over 21% of the market cap of the entire S&P 500 index (and over 40% of the NASDAQ) exceeding the previous 18% concentration level seen during the dot-com bubble of the early 2000s and matching the Nifty Fifty era of the 1970s.

Investment Returns and Valuation
These five stocks plus Netflix have outperformed the rest of the market by a wide margin the last few years. The next graph (July 16, BCA Weekly Report) shows a more than 120% increase in their average stock prices from 2018 versus barely any gain from the average stock (equal-weight index).

These six stocks have experienced very strong sales and earnings growth and thus deserve much of their price appreciation. Many of them are benefiting from both a temporary and permanent change from consumer behavior as a result of the current Coronavirus pandemic. However, when stock prices increase much faster than earnings growth, the danger increases for an investment bubble developing.
The following graph shows the average price-to-earnings (P/E) ratio of the five largest stocks moving from about 26 in early 2019 to about 43 now. This means that about 65% of the price increase is not due to earnings, but to investors placing more value on each dollar of earnings. Why is this the case? If earnings are expected to grow even more rapidly in the future, this would be a rational reason to value earnings more. Whether such an earnings acceleration can be maintained over long periods of time is another matter. History suggests that eventually trends and preferences change, competition grabs some market share, earnings growth decelerates and leaders become laggards (more on this later).

Another factor in valuation is interest rates. The lower the interest rate, the higher the net present value of future earnings. As growth stocks tend to derive most of their value from anticipated future earnings, rather than current earnings, they are much more sensitive to changes in interest rates. When interest rates drop, growth company prices tend to move up faster than for slower growing companies.

The previous chart shows a very high correlation between interest rates on inflation-adjusted Treasury bonds and the P/E ratio of NASDAQ stocks. (Most large growth stocks are listed on the NASDAQ). The Federal Reserve has driven down interest rates during the pandemic. This helped household and business borrowers and this boosted asset prices, with the most pronounced effect being for the companies with the least current earnings, but with prospects of high future earnings (e.g. Amazon, Netflix, Tesla, …). When interest rates rise again—no prediction as to when by us— many of the “growthiest” firms will be negatively impacted.
Bubble versus Elevated Valuation
Elevated valuations can be warranted as discussed before. However, these elevated valuations are also a prerequisite for an investment bubble. When does an elevated valuation turn into a bubble? This happens when investors discard valuation metrics such as earnings, margins and other fundamentals and where there is no price that the investment can be considered overvalued. The future potential is all that matters. As stocks meet and exceed prior price targets, the price targets are raised, as no one wants to sell the hottest stocks on the rise. “It’s different this time” is the mantra used in such situations with new metrics invented to justify the situation and valuation.
Investors buy more of these new paradigm stocks, which begets higher prices and begets more buying—a virtuous price-momentum cycle that can persist for a very long time, so long as there is new money to invest. New money can come from investors’ savings, which eventually must run out, or from the Federal Reserve and other government-fostered capital injections, which can persist for a long time or from money borrowed against ever-inflating asset values. This borrowing element is particularly dangerous if loans can be called in later if collateral value drops or defaults occur—e.g. 2007 housing bubble, 2000 tech bubble and 2020 collapse of several overleveraged mortgage REITs.
As to stock market bubbles, this can apply to a small group of stocks, to one or more hot sectors, or to a much broader market. The move to indexing and buying all stocks in the index can cause all stocks in the index to benefit. There is no differentiation between good, bad, undervalued or overvalued stocks in the index of choice. The S&P 500 is particularly vulnerable to this lack of differentiation as there is no rebalancing of stocks in this cap-weighted index. The “price is always right” for each stock in this index and as the six FAANG stocks make up close to a quarter of the index, it has become more of a proxy for the popular growth stocks rather than a representation of the average stock. The graph on page 2 shows this dichotomy. Furthermore, it shows a common characteristic that emerges in the later stages of bubbles, a narrowing market leadership. As troubling economic and market conditions emerge, investors sell the weaker, less popular stocks and concentrate on fewer and fewer “winners” that can perpetuate the virtuous momentum cycle mentioned earlier, albeit in fewer stocks as time passes.
Signs pointing to a bubble in large-cap tech/growth companies:
- High valuations of largest 6 U.S. firms and NASDAQ stocks
- Narrowing leadership—biggest 6 companies’ stock prices up this year versus general market being down
- Federal Reserve cash injections and low interest rates encourage speculative behavior
- New paradigm—Coronavirus changes everything—suspends valuation discipline
Signs suggesting that a bubble is not fully formed or ready to break:
- Brokerage margin borrowing not accelerating (i.e. still enough cash on sidelines)
- Investors not euphoric overall (Weekly AAII sentiment indicator is still pessimistic)
- Volatility index (VIX) of 22.6, nearly double from a year ago, is not indicative of complacency
- Federal Reserve continues to support market with low interest rates, liquidity injections
Conclusion: Many stocks, particularly the largest, growthiest stocks have bubble-like characteristics. Nevertheless, prices and valuations could continue to escalate for months or years, as their popularity continues in the new pandemic and perhaps post-pandemic periods. Unlike a bubble when prices later plunge, we may instead merely see these stocks plateau and other stocks and sectors take the lead.
What could cause these popular large growth stocks to reverse course and underperform?
- Federal Reserve cuts stimulus or raises interest rates—not too likely for the next 12-18 months
- Recession steepens—no new Congressional stimulus, failure of vaccines, trade wars worsen
- Democratic sweep resulting in higher corporate taxes and regulation of “big tech” firms
- Rotation to post pandemic companies results in money leaving these popular stocks such that virtuous cycle of buying becomes a vicious cycle of selling
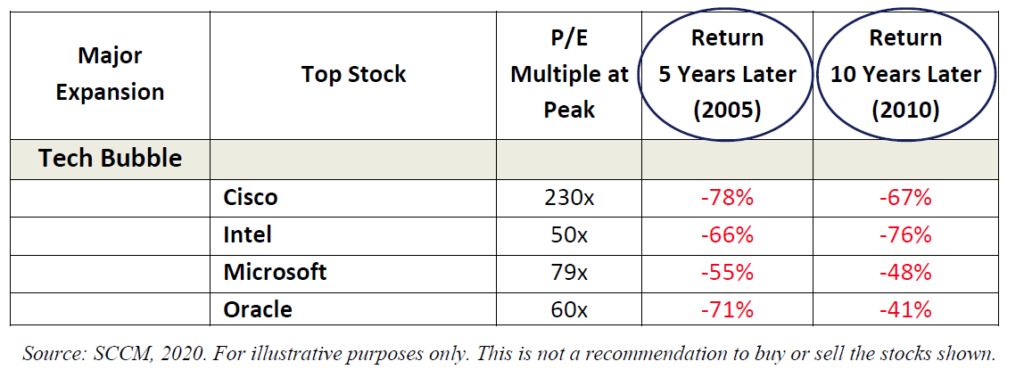
The last time a stock market bubble broke, the tech bubble in 2000, the largest 4 stocks at the time fell significantly and still were down from their highs 10 years later (Shafer Cullen Capital table below).

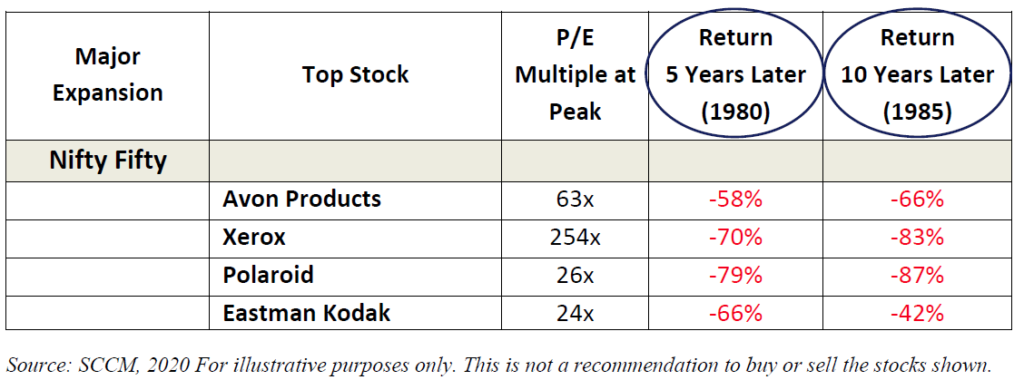
The Nifty-Fifty top 4 stocks showed a similar pattern, as shown below.

Conditions that create a bubble can persist for a long time, making the bubble bigger. But when conditions change and when some catalyst burst the bubble, the results can be devastating. Most bubbles are only fully visible after they break, thus catching many investors by surprise.
Note that only one company (Microsoft) from the prior two tables remains as one of the top 4 market value U.S. stocks today. The others succumbed to changes in technology and customer preferences. It is hard to stay at the top for decades and the only direction from the top is down.
Current Investment Strategy Recommended
Given the foregoing, it is prudent to not have too much of your asset allocation in the largest capitalization stocks. Not only is the S&P 500 increasingly dependent on this small number of companies, but a number of “growth” and technology stock mutual funds and exchange traded funds (ETFs) are even more concentrated in these stocks. It is critical to determine how much of a decade-long loss you can afford to take from this group and then scale your ownership accordingly. For example, if you can afford a 50% loss on 20% of your portfolio for at least several years, then continue to own 20%. Trim this position back if it grows too much more than 20%. If you can identify that the bubble has broken—much as we did in May 2000—consider selling all of these vulnerable assets and rotate to other non-bubble assets.
The largest 5 firms and some other growth stocks are not the only assets that may be in a developing bubble. Some food delivery stocks, among others, that benefitted from the Coronavirus could easily slip back post-virus. Long-term Treasury bonds with yields under 1% due to Federal Reserve actions could easily decline when interest rates revert to normal when there is less buyer demand for ever growing new Treasury securities issuance.
Most assets right now do not have bubble attributes and can be owned now or shortly after a bubble breaks. Small and mid-cap stocks and the equally-weighted S&P 500 fall into this OK to own category of stocks. Value and Growth at a Reasonable Price (GARP) stock categories also look fine and readily available via individual stock selection or via many mutual funds and ETFs. Mid-quality corporate and mortgage securities offer good value. Many foreign stock markets have favorable valuations and currency characteristics, though some Chinese stock indices are also dependent on a small number of technology companies, so some care is needed there too.
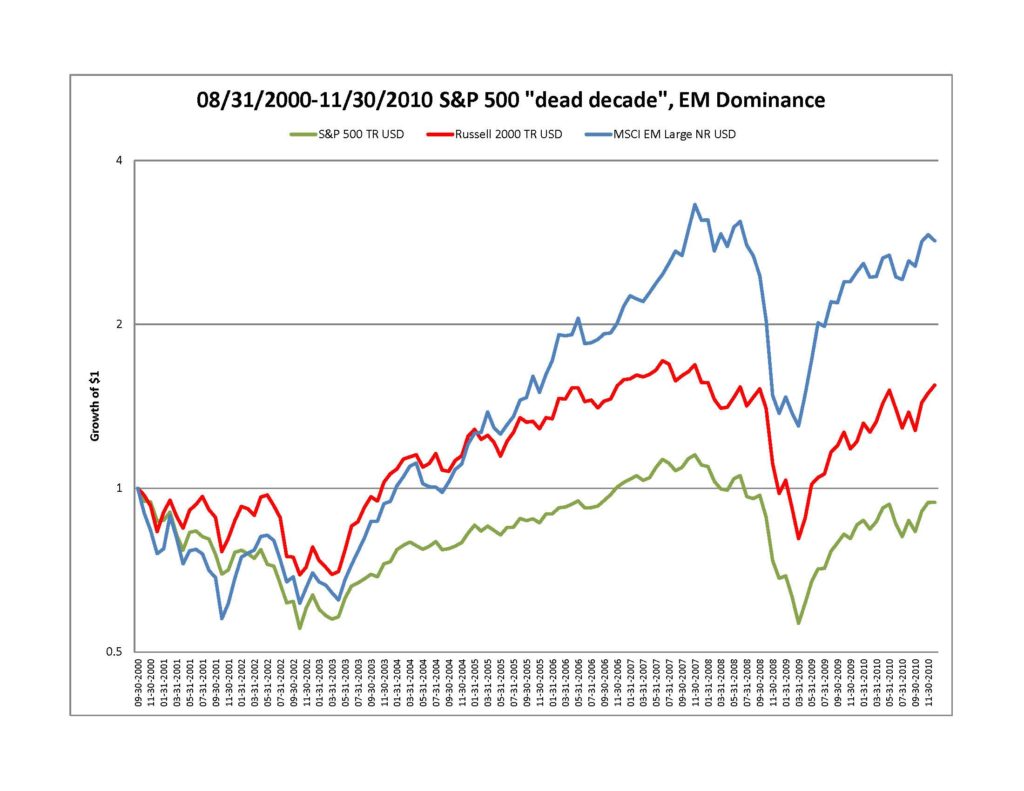
The following chart shows the S&P 500 total return and for two other assets classes, small-cap US stocks and large-cap emerging markets stocks from late 2000 through late 2010. This post Tech Bubble “dead decade” for the technology/communications heavy S&P 500 (in early 2000) showed a negative total return for over 10 years. Could you afford to make no investment profits for ten years?

Meanwhile, the U.S. small-cap Russell 2000 index did reasonably well and the Emerging Markets stock index did extremely well. This reversed the S&P 500’s dominant performance prior to 2000. This pre-2000 S&P 500 dominance is also very similar to the post-2010 dominance going on now (charts available upon request). The point is not to rely on one asset class as the answer to all investing and that both poor and good asset class performances can persist for a long time, but that they eventually reverse.
Some stock sectors are more sensitive to COVID-19 changes, but could recover strongly within the next year. These include REITs, natural resource companies, and consumer leisure/entertainment/travel firms. Only own those that have ample financial resources to bridge the next 12+ months, not only for survival, but to be in position to gain market share from their weaker rivals.
Contact your WESCAP advisor if you have any questions or for additional information.
