Economic and Investment Outlook for 2024

Will the U.S. experience a recession this year? In this report, we explore the outlook for recession and how stocks, bonds, real estate, and other assets are expected to behave. We discuss how investors should be positioned in 2024.
2024 Outlook Summary
- Economic Growth: Higher interest rates may result in a U.S. recession this year. However, if the recent moderation in inflation continues, this may give cover for the Federal Reserve to cut interest rates significantly and avoid a recession.
- U.S. Equities: The S&P 500 is somewhat expensive due to high valuations on the 10 largest companies. Other stocks appear reasonably valued, absent a recession. Higher interest rates and a slowing economy could result in a profit contraction, even without a recession, which could result in short-term stock declines. Therefore, continuing to emphasize a more defensive stock allocation is warranted.
- Foreign Markets: Economic conditions, cheap currencies, and attractive valuations make assets in many larger foreign developed and emerging markets attractive. Therefore, we continue to recommend a substantial allocation to assets linked to these countries. Avoid China until conditions show material improvement or valuations fall further.
- Fixed Income: U.S. interest rates are expected to stabilize and then perhaps decline. This makes most high-quality fixed-income investments attractive this year, the complete opposite from two years ago. Very short-duration and adjustable-rate fixed-income assets are attractive as they rapidly capture the benefit of rising interest rates. However, these interest rates will begin to decline as inflation risks moderate, and a pivot to longer-term high-quality assets becomes prudent. Credit-sensitive fixed-income assets continue to offer high yields, but if the risk of recession increases, then a pivot away from these is warranted.
- Real Estate: Single family residence prices have been resilient in the face of higher mortgage interest rates due to low housing inventory, strong employment, and wage growth. However, commercial properties, especially office buildings, are showing signs of stress with escalating mortgage defaults expected.
- Alternative investments: These still have a place in portfolios due to lower correlation and volatility when compared to stocks and traditional bonds. If a recession develops, these can outperform most other assets. Alternatives include hedged strategies and private non-traded investments. Mutual funds, ETFs, and hedge funds are all avenues for investing in this area.
Economies, Markets still at risk due to Geopolitical turmoil
Last year, we stated that “COVID-19 no longer appears a threat to global economic growth.” Fortunately, this turned out to be the case. This resulted in large improvements in supply chains, reducing inflation. It also resulted in high levels of consumer spending in entertainment, travel, and other services, which helped buoy employment and global growth.
Nonetheless, geopolitical risks have escalated further. Not only are commodity prices still distorted due to the Russian invasion of Ukraine, but the Israeli-Hamas conflict could worsen this both in terms of higher energy prices and costly disruptions to shipping lanes.
A polarized and split U.S. Congress means that very little legislation is expected—no material changes to income or corporate taxes, regulations, or new spending. However, a repeat of the debt ceiling impasse will likely result in additional political theatre brinksmanship. While we do not expect any major long-lasting damage from this, short-term stock and bond price gyrations are expected. A presidential election year is likely to accentuate uncertainty.
Conflicts are hard to predict in advance, but it is likely that additional destabilizing events will occur over the next few years. The retreat of globalization and the resurgence of nationalism continues. From an investment perspective, unexpected negative developments can hurt long-term investment returns if investors overreact, or they can be positive to long-term returns if investors adapt to new conditions and take advantage of temporary asset price dislocations.
Reduced Inflation Outlook for 2024 Results in Lower Interest Rates
A year ago, in our 2023 Outlook we concluded “current trends and expectations suggest that inflation will trend sharply lower this year”. This turned out to be accurate for reasons that we discussed in that earlier report (available at wescapgroup.com).
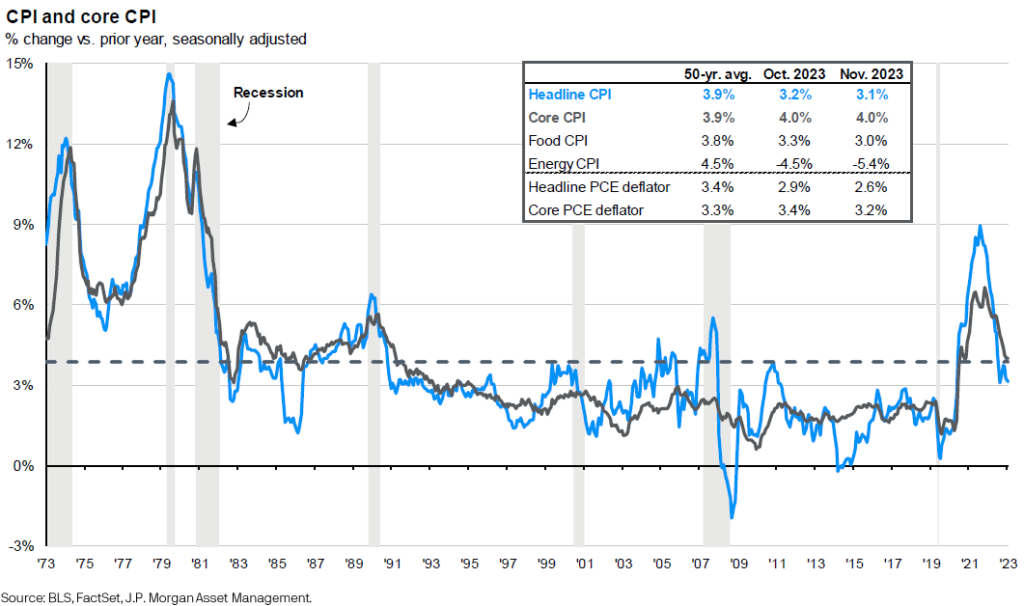
As shown in the prior graph, both headline CPI and the Personal Consumption Expenditures (PCE) decelerated over the prior 12 months to 3.1% and 2.6% repectively. Also, the trend is down and if this continues, the Federal Reserve (Fed) can cut interest rates in the first half of 2024, which will be beneficial to the economy and most asset classes.
Our main focus has been the U.S. Consumer Price Index (CPI), particularly the Core version of the CPI and excluding the “shelter” component. Core CPI is important because it strips out supply-shock-sensitive food and energy costs and thus is better at giving a truer short-term picture of underlying demand-driven inflation.
Residential “shelter” costs (i.e., rents) account for about 40% of the core CPI. Because shelter costs are determined by a survey of renters and rents are typically increased only every 6-12 months, these CPI shelter costs often lag current rental conditions by 6 months or longer. Stripping out this lagged component of the CPI gives a truer picture of what is happening currently with inflation. The Fed also pays particular attention to this Core CPI, ex-shelter inflation component for the same reasons mentioned above.
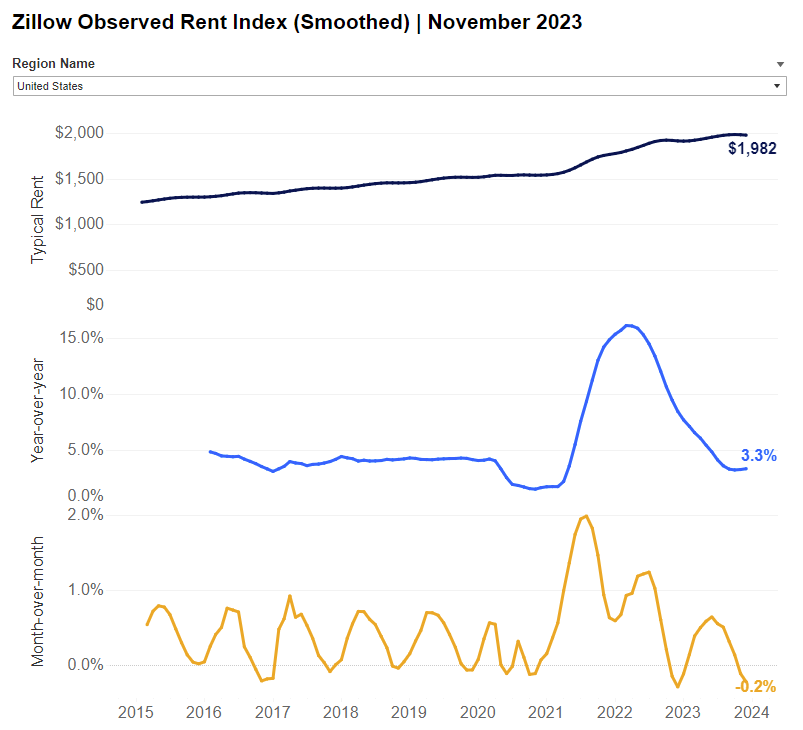
As the graph to the left shows, current monthly rental trends show that rent increases have come down rapidly this year. The trend is slightly negative now (yellow line), though seasonal factors account for some of this. Year-over-year, monthly rents have increased only 3.3%, which is well under the 6.5% lagged Shelter CPI cost component over the same 12 months.
If we strip out the shelter component, then the Core CPI is only up 1.8% annualized for the last 6 months. This is below the 2% inflation target that the Fed has set.
U.S. rental vacancy rates have increased to 6.6%, up over 1% from the 2022 lows (Y-Charts, below).

The increasing vacancy trend suggests future weakness in residental rental costs. For example, if rents only go up 2% this coming 12 months, then we could see the Core CPI, including shelter costs rise by a modest 2.6%. This would still be higher than the Fed’s 2% target inflation rate, so other components of inflation (food, energy, other service costs) or rents might need to decelerate further before the Fed declares victory and starts cutting interest rates.
The PCE inflation measure puts less emphasis on shelter costs (about half), and includes certain costs that the CPI does not include. It more quickly reflects what consumers are actually buying, so the PCE is somewhat preferred by the Fed over the CPI. As mentioned earlier, the PCE inflation the last 12 months was 2.6% and declining rapidly. It is probable that PCE inflation will drop to 2% before the CPI does. To the extent that the Fed acknowledges this, they can begin to cut interest rates sooner rather than later.
Interest Rates and Recession Outlook
The U.S. Federal Reserve began an aggressive series of interest rate increases starting in March 2022 in order to quell inflation. The Fed has raised the upper end of its Fed Funds interest rate target from 0.25% to 5.5%. However, it has not increased interest rates the last few months, when it could have. The Fed also suggested that they could begin cutting rates in 2024, if inflation continues to moderate, as it has been recently.
Historical evidence indicates that a recession is highly likely 18-24 months after the Fed initiates such a large and rapid increase in interest rates. An inverted yield curve plus tightening of credit standards suggest a recession coming soon, using history as a guide.
However, a recession has not yet occurred and other factors make historical comparisons less reliable. One reason why a recession may not occur is because the unemployment rate may not rise as it did in the past after a series of large interest rate increases.

The chart above shows the ratio between unemployment and job openings going back to 2000. For most of this period the number of unemployed people relative to jobs available by employers averaged close to 2 to 1 and exeeding 3 to 1 in 2003, 2009-12 and early 2020 (details at https://fred.stlouisfed.org/graph/?g=p9aA). However in April 2021 this ratio went below 1 as there were more job openings than unemployed people. It was hard to find workers during the middle phase of the Covid pandemic. Many businesses had reopened and needed more workers, but many people had exited the labor force. This ratio hit a low point of 0.474 in April 2023 before rising again to 0.716 in November 2023. Taking the reciprocal of this ratio, this translates to 2.1 job openings per unemployed person in April 2023 and a still high, but rapidly declining 1.4 job openings per unemployed person in November 2023. This is a relatively large change in a short period, reflecting a weakening jobs market and more people seeking employment.
Job openings have been declining as higher interest rates, and tighter borrowing conditions are having an effect at slowing economic growth, just as the Fed intended. Many businesses have been fearing a recession since 2022 and some have been more cautious in hiring as a result.
Even as some employers have shed jobs or just refused to hire more people, there are still enough job openings to absorb any qualified unemployed person. As a result, the unemployment rate remains near all-time lows, close to 3.7%. Until job openings per unemployed person falls below 1.0, it is hard to see actual unemployment going up and a recession beginning. It also means the current low unemployment rate does not properly reflect growing labor market weakness.
If we extrapolate the reduced job availabilty trend starting from April 2023, the ratio of job openings per unemployed person could move below 1 in March or April 2024. Then we could see actual unemployment rise as not enough new jobs would be available to absorb layoffs.
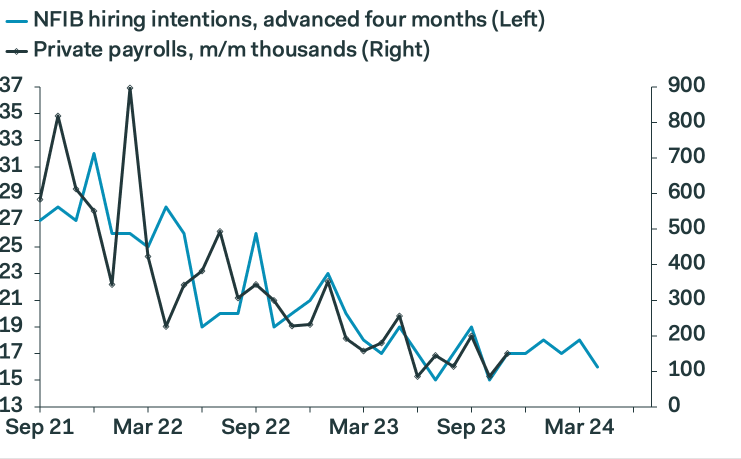
As we can see from the following graph (Pantheon Global Economics, NFIB), labor markets have been cooling off. The National Federation of Independent Business (NFIB) shows that small businesses’ hiring intentions have dropped by half from two years ago (Blue line). This tends to lead the Private Payrolls report by about 4 months, so some additional weaking in payroll growth could begin sometime near the second quarter or 2024.
Furthermore, wage growth is dropping sharply per the graph below. In June/July 2022, 3-month wage growth per hour increased at an annual rate of 6.7% for all workers (blue line) and 8.0% for those changing jobs (grey/brown line). By November 2023, this wage rate growth had declined to 5.2% and 5.7%, respectively. If the trend continues, then wage growth could decline to about 4.5% later this year, and those changing jobs may no longer get a material pay hike. Big pay hikes when changing jobs is a very good indicator of tight labor condition. The converse is also true, and the large recent decline in wage growth for job changers indicates weakening labor conditions.
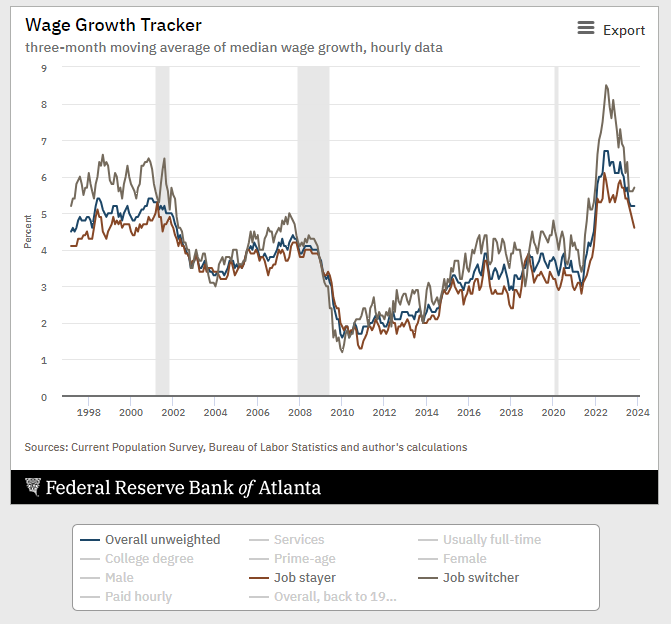
The Federal Reserve may want to see wage growth closer to 3% annualized before it begins cutting interest rates as wage inflation remains one of the Fed’s primary concerns. The longer the Fed keeps interest rates in the over 5% range, the more likely a recession becomes.
It is possible that some election-year stimulus will offset slowing growth, though it will be hard to get a split Congress to go along with any significant increase in stimulus spending.
If the Federal Reserve begins to cut interest rates in the second quarter of 2024 and continues aggressively lowering interest rates, then the loosening of monetary conditions may create enough business and consumer confidence to avoid a recession. However, the Fed has not been forecasting early or deep interest rate cuts in 2024, and so far the Fed has been pretty consistent in following their earlier guidance. So while the Fed may take steps to help avoid a recession, we should not count on this.
Over the next 6 months, we expect that forthcoming data regarding labor, jobs, wage and inflation will be critical in determining if a recession is more likely than not.
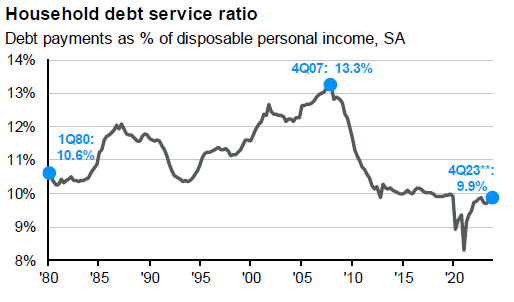
If a recession develops, it is not likely to be too long or deep. Most households and businesses are in reasonably good shape to weather a typical recession. Household debt payments as a percentage of disposable current income was much higher in 2007 and most earlier time periods, per the left graph (JP Morgan Guide to the markets).
Home prices are holding firm despite higher interest rates as the inventory of homes available for sale is very low. Therefore, the inability to service debt on a large scale and resulting asset liquidations at distressed prices as experienced in 2000-02 and 2008-09 is not likely to occur this time around. A recession will result in higher loan delinquencies, but lenders (including banks) should have ample reserves to get through this, with the exception of a few undercapitalized lenders and those with significant exposure to the riskiest assets (e.g. office building loans).
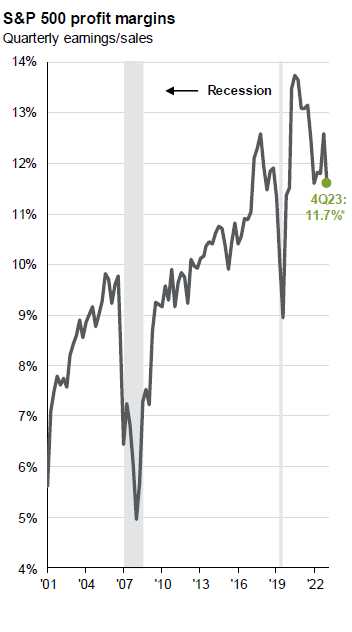
Large firms appear to be in good shape. S&P 500 average profit margin (left chart) stands at 11.7%, which is not far from the high. Nevertheless profit margins are in a contracting trend, which has translated into a corporate profits “recession” in 2023 that may continue into 2024.
Smaller firms are typically not as resilient in a recession.
As any forthcoming recession will likely result in bump in unemployment and a decline in wage increases and inflation, the Fed can begin to cut interest rates at that time and quickly reverse the recessionary damage to the economy. This would be similar to the April to November 2001 recession. This lasted only 8 months, and the economy (GDP) only fell 0.3%. Other than the dot.com asset price bubble bursting, which had begun a year earlier, there was not significant and long lasting asset price and employment distress.
So whether we barely avoid a recession or experience a shallow recession is hardly going to make much difference in the longer run. If we look forward about 24 months to 2026, past any recession event, we don’t expect the economy to look much different than it does now, other than lower interest rates and inflation, which will be good things. Wage growth may have slowed, and the unemployment rate could be somewhat higher than now, but otherwise not out of the ordinary.
As to the rest of the world, economic trends and risks are pretty similar to the U.S., as Covid-related issues and responses were global and not limited to the U.S. Inflation was higher in some regions and lower in others, but the trends were and are the same. The risk of recession is higher in Europe, lower in Japan, and a mix within emerging economies. This does affect how assets should be allocated.
Investment Implications for U.S. Stocks in 2024
Looking back to the last couple of years, stocks appeared to be pricing in a recession for much of 2022 and again in 2023. While no recession occurred those years, fear of recession resulted in large price movements in global stocks and bonds. We expect fear of recession to continue to result in price volatility in 2024, regardless of a recession occuring.
U.S. stock appear somewhat expensive again, as the S&P 500 is trading at 19.5 times forward earnings, as shown in the next chart and graph. The other times that the S&P has traded close to or above 20 time earnings, the S&P 500 experienced significant declines (2000, 2020, 2022).
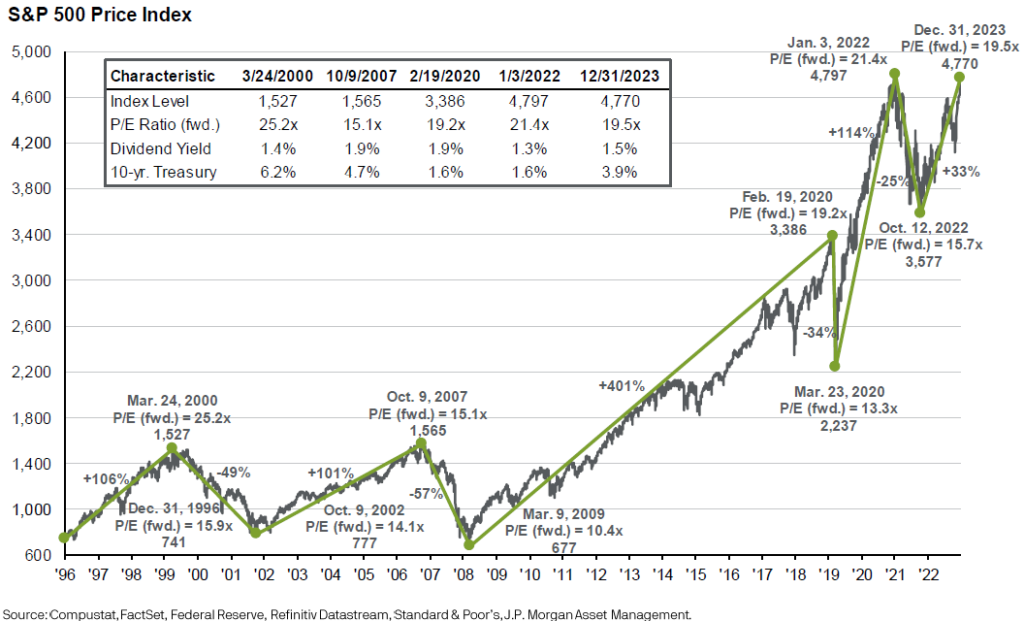
Valuations do matter. When stocks trade at elevated valuations, the returns over the next 5 years tend to be anemic at best.
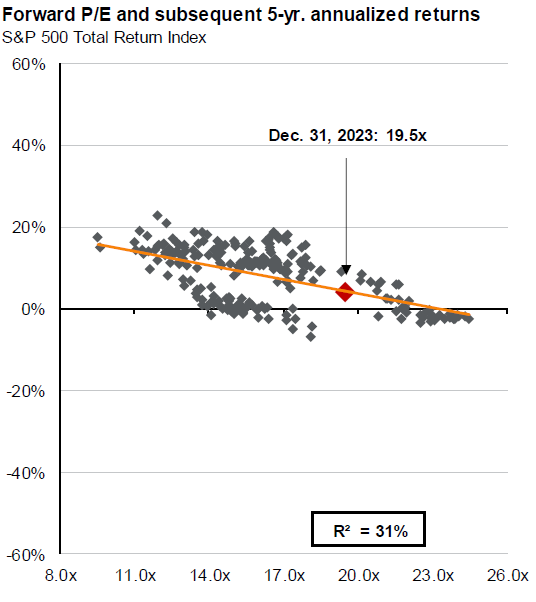
Historically, when the S&P 500 has been valued close to 19.5 times earnings, like now, the average annualized return 5 years hence has been close to 5% (red square on graph to the left, JP Morgan Guide to the Markets).
When priced over 22 times, 5-year returns have been flat or negative.
When priced at 11 to 14 times earnings, returns have averaged over 10%/year.
So the current valuation suggest a positive, but below-average S&P 500 return over the next 5 years.
It may be worse for the largest companies.
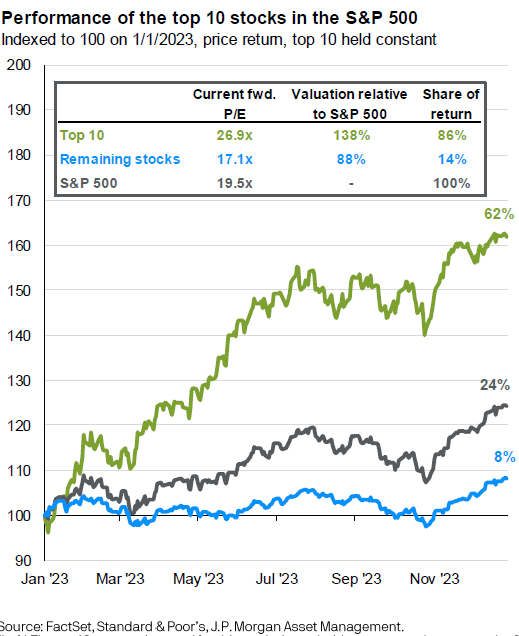
The largest 10 companies sport a price to earnings ratio of 26.9 whereas the other 490 stocks in the S&P 500 are priced at 17.1 times earnings, making these 10 stocks 57% more expensive than the other 490 (left chart) based upon earnings.
These 10 stocks were up 62% in 2023 (green line). The other 490 stocks advanced 8% (blue line) and were actually down for the year until the last 2 months of 2023.
While these 10 stocks (e.g. Microsoft, Nvidia, Apple, Amazon, etc.) have favorable growth prospects, price appreciation greatly outpaced recent earnings growth. Other reasons for such strong price apprecation of these top 10 stocks include resistance to economic cycles (i.e. resistance to inflation and recession), low debt levels and dominant positions in their industries. The popularity of capitalization-weighted index funds and algorithmic (computer) trading has accentuated the price appreciation in these mega-cap growth stocks. While this may continue for a while, such massive concentration in a few stocks, with high earnings multiples and extreme recent price performance, has a 2000 era “bubble” quality to it. See https://www.wescapgroup.com/2020/08/20/tech-bubble-deja-vu/ for our previous analysis of this. Since we wrote this in late August 2020, growth stocks experienced a very large decline in 2022 before the 2023 strong rebound. This can be seen in the chart below which shows the Wilshire Large-Cap Growth Index total return divided by the Wilshire Large-Cap Value Index total return. The line moving up means growth stocks are outperforming and the line moving down means value stocks are outperforming. Since September 2020 growth stocks have not been outperforming value stocks as they had the prior 10 years. Since January 2022, growth stocks have slightly underperformed value stocks. Our late 2020 recommendation to place less emphasis on growth stocks still holds. While any growth stock bubble has not yet broken, the risk of a bubble breaking is still high.
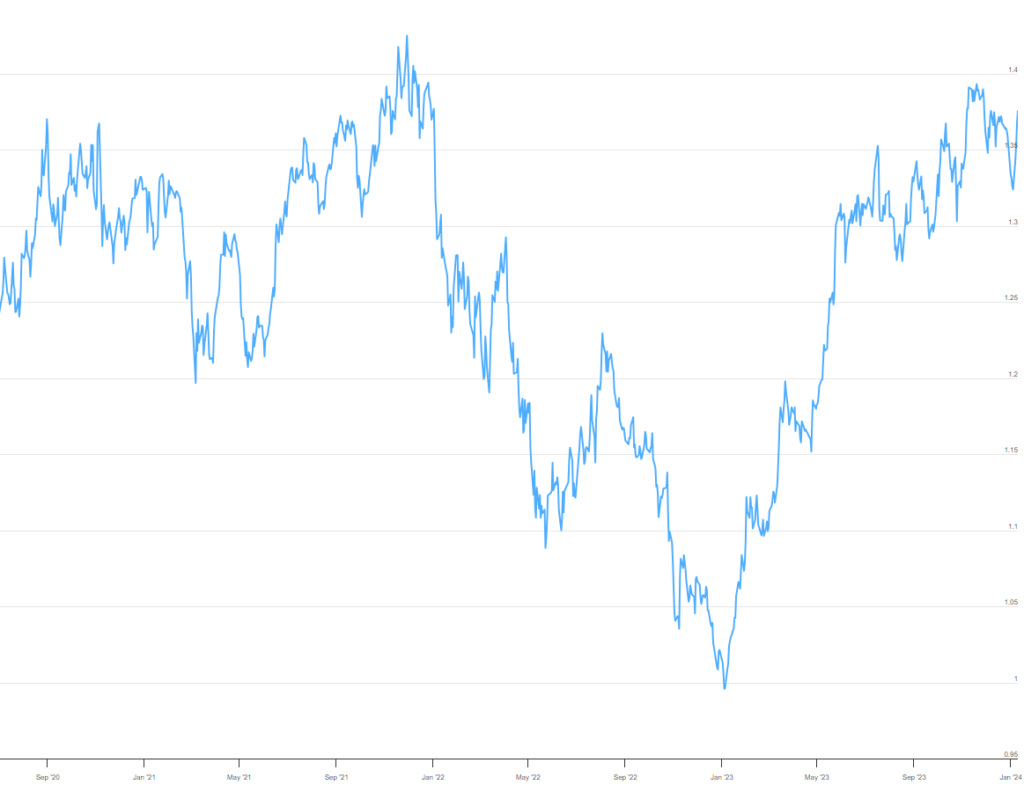
www.longtermtrends.net/growth-stocks-vs-value-stocks/ Aug. 2020—Jan. 10, 2024

Growth stocks are expensive relative to their long-term average, whereas value stocks are not, as can be seen in the left chart (JP Morgan). Over the next 5 years, a bias towards value stocks is expected to be beneficial, much as it was in 2000-2002 period.
However, owning some growth stocks can be beneficial during a recession for several reasons. Interest rates tend to drop, which helps growth stocks somewhat more than value stocks. Growth stocks tend to have less debt and have larger and more resilient profit margins, which also helps. However, coming out of a recession, value stocks (e.g. financials, energy, industrials, consumer cyclicals) tend to outperform. As recession is still a risk, owning both growth and value stocks is currently warranted. If a recession is avoided, or post recession, a shift to value stocks is warranted. Many health care stocks have growth-like attributes (recession-resistant revenue and margins) and currently have reasonable below S&P 500 valuations, so they bridge both sides of the growth/value divide. They underperformed in 2023, but are outperforming since November 2023 as rotation into this sector has occurred.
Given the higher-than-typical current risk of U.S. stocks and the lower than historical expected 5-year forward total return, we recommend an underweight to U.S. stocks and overweight to various types of fixed income, foreign and other assets/strategies discussed later in the report. However, should a recession or geo-political event trigger a significant price decline, an increased weighting to U.S. stocks will be in order.
Foreign stocks and Currencies: Below is a chart showing the S&P 500 results in both 2023 and 2022 (JP Morgan Guide to the Markets). Many of the foreign stock markets are also shown, both in “Local” or currency-hedged terms and “USD” for non-currency hedged returns when measured in dollars.
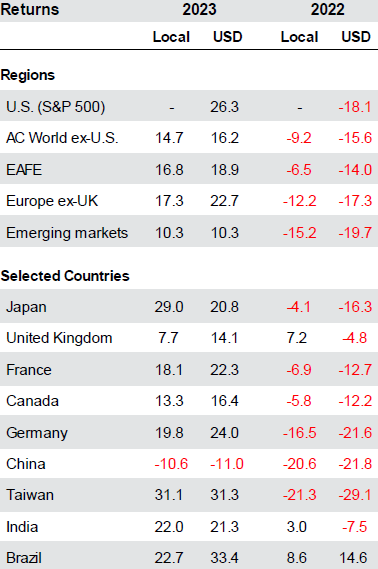
U.S. stocks did quite poorly in 2022, but rebounded in 2023, which resulted in a 3.4% cumulative 2-year total return.
The developed foreign market (EAFE) index in local/currency hedged terms had a 2-year cumulative return of 9.2%, more than double the S&P 500. On an unhedged basis, the EAFE index had cumulative 2-year return of 2.3%. Currency hedging, which removed the poor results of the euro, yen and pound, added 6.9% cumulatively to the EAFE results.
We have long advocated that currency hedging be a part of any foreign investing activities, as it tends to reduce volatility and add to returns when the U.S. dollar is strong.
Nevertheless, the dollar can become overvalued, which appeared to be the case during the course of 2023. The 2023 USD column returns tended to be less than the 2023 Local column returns in most cases, showing that the dollar was weakening in 2023. The dissipation of recession fears and the Fed ceasing to raise interest rates contributed to the modest decline in the dollar.
In 2023, we slightly decreased our currency hedging, which was the correct move for the majority of foreign markets due to an overall weakening of the U.S. dollar. Assuming the Fed cuts interest rates in 2024, this will favor non-U.S. currencies. However, during a recession, a flight to quality to the U.S. would favor the dollar. Therefore, our short-term strategy is to maintain high currency-hedging, but to decrease it in the longer run.
The cost of currency hedging is quite expensive for emerging markets, so there is less advantage to do so. Brazil, India and Taiwan did well, even in USD terms, per the prior chart. The exception was China.
China ceased its Zero-Covid policy over a year ago. We and others thought this would result in strong consumer led rebound in the economy and Chinese stocks. However, this did not occur. China’s reliance on housing sales and property development backfired, resulting in overbuilding, housing price declines, and defaults or bail-outs provided to various developers and financial entities. Like the bursting of the U.S. housing bubble last decade, this could be a drag on the Chinese economy for years to come.
China’s share of the emerging markets index has declined from a high of 38% to 24% at year-end 2023. So China has less impact than in the past. Additionally, we have added some EM investments that exclude China entirely or reduce it via a lower China weighting (eg. Small-cap emerging markets).
Due to the smaller index weighting from China, the overall emerging markets index returned 9.8% in 2023, even though China stocks declined 11%.
As can be seen (chart below), China’s corporate earnings estimates have not shown a meaningful recovery versus all of the other major regions. However, China stocks are trading at only 9.3 times expected earnings (light blue diamond, far right graph). This is less expensive than the rest of the major markets and relative to its own history. At some point, China will be a good investment again, but we plan to wait to see increased evidence of this.
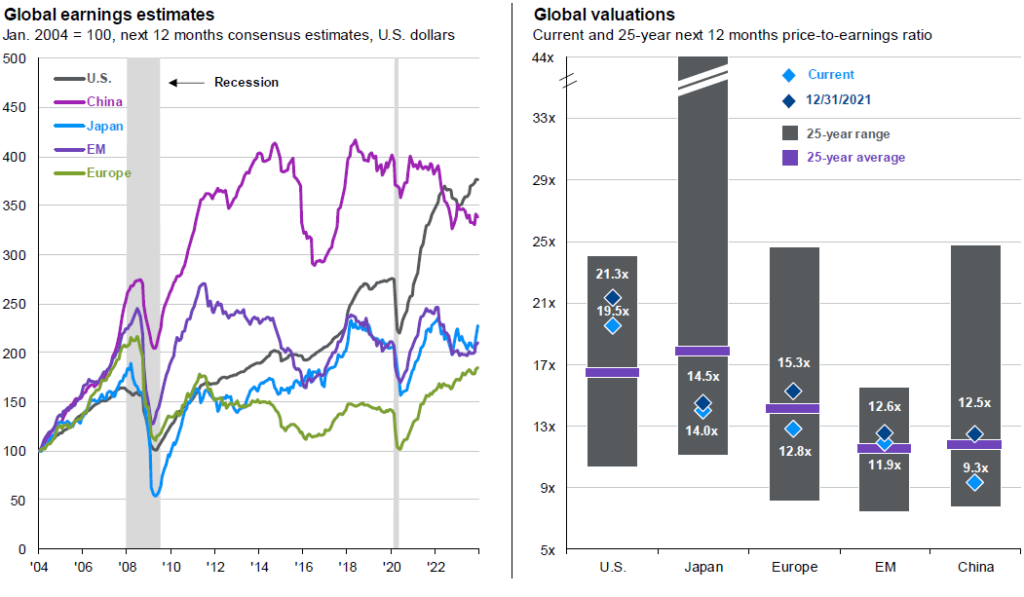

Meanwhile Europe and Japan each have inexpensive valuations and are showing improved corporate earnings growth. Like U.S. value stocks, there is potential downside during a recession, but their relatively inexpensive valution provides some downside protection when compared to the relatively more expensive S&P 500.
Fixed Income: Fixed income assets now offer reasonable yields, unlike two years ago. In order to fight inflation, most central banks have raised interest rates and reversed many stimulus measures. Both short-term and long-term interest rates rose significantly. However, by the fourth quarter of 2023, longer-term interest rates declined modestly, in line with quickly declining rates of inflation. This resulted in positive 2023 total returns to most fixed income asset, both in the U.S. and overseas.
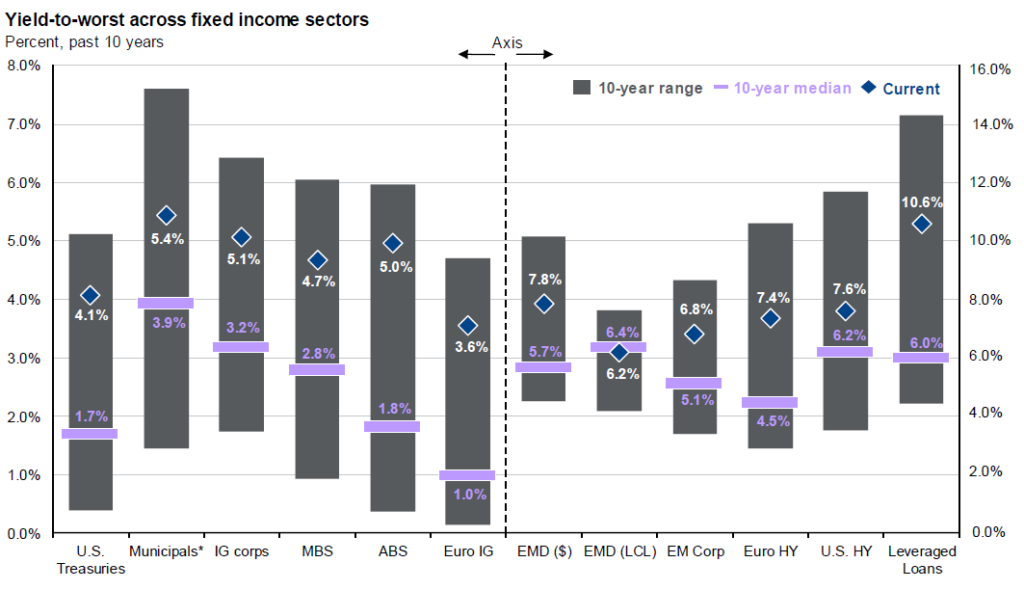
The next table shows various income yields as of year-end 2023. It also shows the 10-year average yield to shortest possible maturity (yield-to-worst).

The U.S. Treasury securities index
had a year-end yield of 4.1%, considerably higher than the 10-year average of 1.7%. Assuming inflation rates continue to subside,
we would expect Treasury rates to trend down as well. A recession would be expected to also result
in lower interest rates. So either way,
we expect long-term Treasury yields to
decline. Therefore, it is increasingly
attractive to extend maturities in fixed income assets to lock-in these still
high interest rates.
Investment grade corporates offer a higher yield at 5.1%, though a recession could send yields higher (prices down) for a period of time. High yield bonds offer a 7.6% yield, but could suffer considerably in a recession. The same can be said of leveraged loans, though the current yield of 10.6% could absorb considerable default risk. However, banks loans have floating interest rates that could quickly decline when the Fed starts cutting rates.
Emerging markets dollar-denominated bonds offer an attractive 7.8% yield, well above their 10-year average yield of 5.7%. Being dollar-denominated, if U.S. yields come down and prices rise, then high-quality dollar-denominated emerging markets bonds should follow.
Short-term money markets and T-bills—not shown above—with close to 5% yields and with little or no price risk, remain attractive, at least until the Fed cuts short-term interest rates.
A mix of these fixed income assets is recommended—different types, different maturities, and different quality types. Extending maturities this year and reducing credit risk is also recommended. If a recession develops, credit sensitive fixed income can be added at lower prices (higher yields) than currently.
Real estate: Residential single-family real estate prices surged during the pandemic as work-at-home and movement from high-density to more affordable lower-density locations took place. Mortgage rates plunged as the Fed’s stimulative policies assisted buyers. Lower interest rates in 2020 and 2021 absorbed some of the effects of higher real estate prices. However, mortgage rates rose in 2022, hitting 7.7% in October 2023, causing home affordability to plunge (see next table showing mortgage rates, other factors and the overall U.S. home affordabilty index).
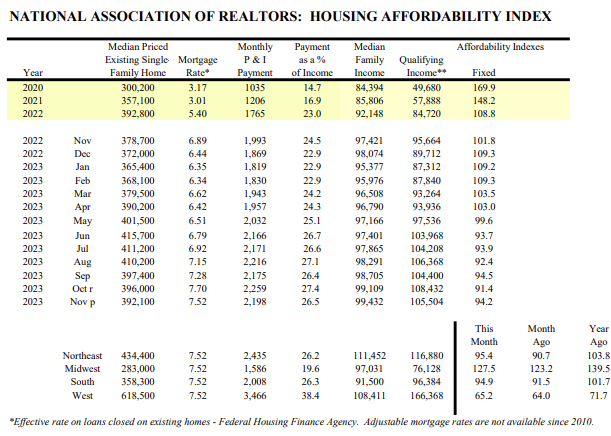
Such a low affordability reading often presages a real estate recession, with
real estate prices falling and defaults rising. Home prices declined by close
to 7% in 2022 as can be seen in the next chart.
However, somewhat suprisingly, prices began to rise again in 2023.
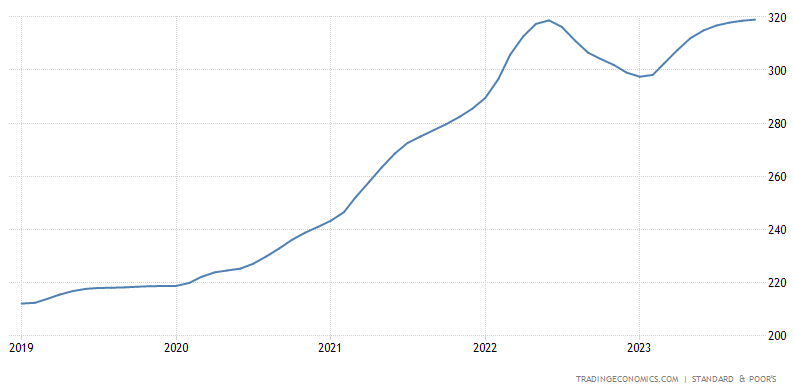
Supply of housing available for sale also declined. Builders reduced their inventory, and existing homes were less available for sale as current owners did not want to give up their low mortgage rates. Therefore, qualified willing buyers, which declined in 2023 were more than offset by a relative lack of supply of homes for sale. A strong employment market, including higher inflation driven wages, was sufficient to keep housing prices rising in 2023.
As mentioned earlier, wage growth is cooling off and unemployment could rise later in 2024. However, mortgage interest rates have recently declined by a full percentage point, and it is likely that they will decline further if inflation also moderates. If a recession occurs, then mortgage defaults are expected to rise, but defaults and distressed home sales should remain low enough not to trigger another housing debacle as occurred in the 2007-2010 period.
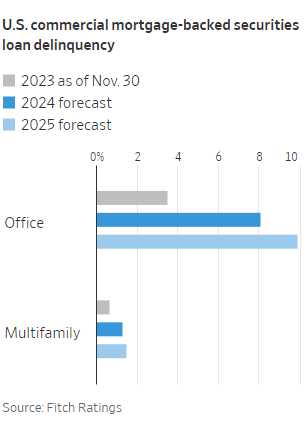
The same cannot be said for some commercial properties. Most commercial properties are financed with interest-only loans. If property prices decline, then some loans cannot be refinanced when the loans come due. Per Tripp, Inc., a mortgage data provider, about $1 trillion of commercial property loans are coming due in each of the years 2024 and 2025. Even if they can refinance, commercial property mortgage interest rates are much higher than when the mortgages were originated. Many commercial mortages also are variable-rate, which has been squeezing proft margins of commercial property owners.
The chart to the left shows projected default rates for the next 2 years. Multi-family, the largest propery sector is projected to show a near-doubling of defaults, though still under 2%. However, office building loan defaults are expected to rise from over 3% now to close to 10% in 2025. The work-at-home trend did not dissappear post-Covid, resulting in increased office vacancy rates as tenants downsized their space needs. As current leases expire, this downsizing trend is expected to continue. Lower rental revenue also means lower property values and an inability to refinance or afford higher loan payments on variable-rate mortgages.
Commercial Edge estimates that $150 billion of office building loans are coming due in 2024 and about an equal amount in the 2025-2026 period. If 9% of these loans become delinquent in the next 2 years, this translates to just under $30 billion of mortgages and forced office building liquidations. This is small enough not to create much distress to the overall economy, but regional banks may be hit hard. Regional banks make about 50% of commercial property loans, with pensions, insurance firms and a few others making up the balance. Therefore, some of these regional banks may face difficulty in the coming years. However, a few failed regional banks are unlikely to trigger a wider financial contagion, as the “too big to fail” banks have much less relative exposure to office mortgages and have strong balance sheets. Moreover, the Federal Reserve will provide liquidity and financial backstops to these large banks to prevent another 2008-style financial crisis.
While industrial, retail and apartment properties still have strong operating fundamentals, it would not be suprising to see some financial stress develop due to higher mortgage rates. It is hard to see much price appreciation from most commercial properties in this type of environment, at least not until mortgage interest rates drop significantly.
Hedged and Alternative Assets and Strategies: Some assets are thought to be good inflation hedges. These include tangible assets like gold and other commodities. This might be true for very long periods of time (decades) or for countries that experience hyperinflation (1920s Germany), but the correlation of these assets to a normal range of inflation (2-7%/year) is low in the short run. These may provide some inflation protection in some periods and fail in others. In 2023 the record was mixed. Energy assets did quite well in 2022, but declined in 2023. Gold was flat in high-inflation 2022 and then had more positive returns during disinflationary 2023. While gold, oil and other commodity short-term inflation hedging is questionable, they nevertheless tend to have lower correlations to stocks and bonds and can provide decent diversification benefits to a portfolio. Commodities and precious metals have typically underperformed stocks in the long run, as they have no earnings and pay no interest, and growth in demand for these physical assets tends to be less than overall global economic growth. But there can be cycles in which these assets can be attractive.
Owning assets or employing strategies that are not highly correlated to stocks, bonds, inflation, or interest rates can have an important role in portfolios. Various hedge fund strategies attempt to hedge out traditional stock or bond market risks. Such strategies often use a long-short approach, going long for the more attractive asset and going short for the less attractive asset. Profits are made when the long asset outperforms the short asset, and the hedge (being both long and short) tends to keep volatility low. Examples of this include merger arbitrage, convertible bond arbitrage, and long-short allocations to various types of stock and fixed-income assets. There are many hedge funds that have the flexibility and expertise to follow these strategies. For those who do not qualify for or want to avoid hedge funds, there are a small number of accessible mutual funds that have been successful as well.
Alternative illiquid investment strategies provide another option. This category often includes owning private market investments (e.g., private equity, private debt, art, farmland). Private market investments can have higher returns than public stock and bond markets due to the return premium demanded to hold illiquid assets. There are a number of hedge funds and private investment vehicles that focus on these types of assets. Additionally, there are some publicly-registered closed-end and interval mutual funds that offer ownership in some of these non-liquid assets.
Hedge fund, illiquid, and alternative strategies can be very diverse, as can the mutual funds and ETFs following similar strategies. Considerable expertise is required for understanding the pros and cons of various approaches. We intend to hold a number of these in various portfolios and we are available to discuss these investments in more detail.
Conclusion
Volatility is expected to remain high for stocks, with some stock sectors and countries experiencing positive returns in 2024, with others struggling, particularly if a recession is brewing later this year or early next year. The 3-5 year outlook is better since this would include any post-recession recovery. Value stocks, small stocks, and foreign stocks offer the best prospects of above-average returns over this 3-5 year period, although this would likely temporarily reverse during a recession. For 2024, a somewhat defensive posture is warranted. Long-term higher-quality bonds have become more attractive, while lower quality high-yield bonds and bank loans may be facing several headwinds. Short-term and variable-rate, high-quality fixed-income investments are currently very attractive due to high yields and low risks. Alternative and hedge fund-like assets may provide reasonable returns and offer diversification from traditional stocks and bonds.
WESCAP will continue in its efforts to add value by following a disciplined asset allocation approach tailored to appropriate risks, with frequent rebalancing, while taking advantage of market and valuation trading opportunities.
For more details, please contact your WESCAP Group advisor.
